A Ten-Year Analysis of the May 2018 Existing-Home Sales Figures
Every month NAR produces existing-home sales, median sales prices and inventory figures. The data is released with a one-month lag (so the May data is released in June) and is reported on a seasonally adjusted annualized rate. We also provide a perspective of the market relative to the same month one year ago and relative to the previous month and comment on the potential direction of the housing market.
In this blog post, I look at how the May 2018 data looks like in comparison to each of the last ten May months and the ten-year May average, which is an average of the data from the past ten May months. I also compare the May 2018 data against the May 2008 figures.
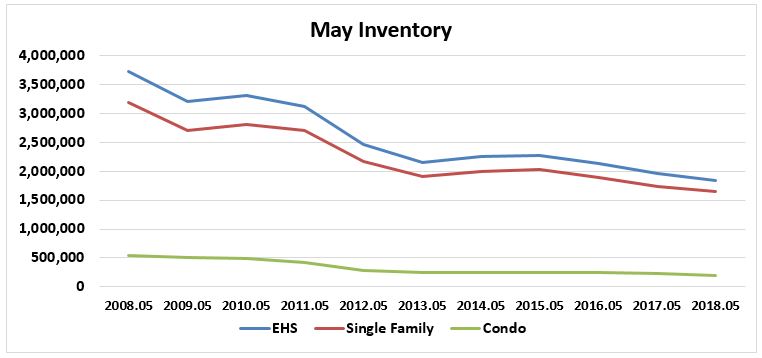
Inventory trends. One noticeable factor that stands out in this ten-year period is the significant drop in inventory. Comparing figures from May 2008 through May 2018, inventories across the U.S. are down by a considerable 50.4 percent. The drop in inventory stands in sharp contrast when compared with population growth. The population in 2008 was at 304.1 million, while currently is up 328.1 million[1], an increase of 7.4 percent compared to ten years ago. Single-family inventory in May 2018 was down 48.3 percent and condominiums have fallen by a significant 63.4 percent.
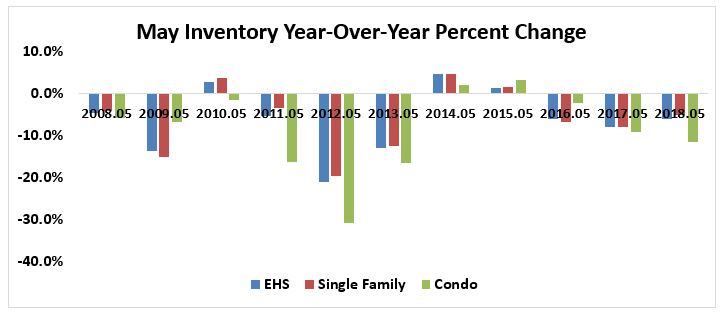
Broadly, May inventory figures over the ten-year time period have declined substantially, having only modestly increased in a few instances. It was not until 2010 that the U.S. and single-family experienced gains even though condominium inventory was still down. In 2012, inventories had their biggest dip in both single-family and condominiums with condominiums having a decline of 30.9 percent. Also in 2012 total inventory declined 21.1 percent while single-family fell 19.6 percent. Inventories have continued to decline since 2015 and condominiums have reach double figures at 11.6 percent this year. There are also currently fewer homes available for sale in the U.S. this May than the ten-year May average.
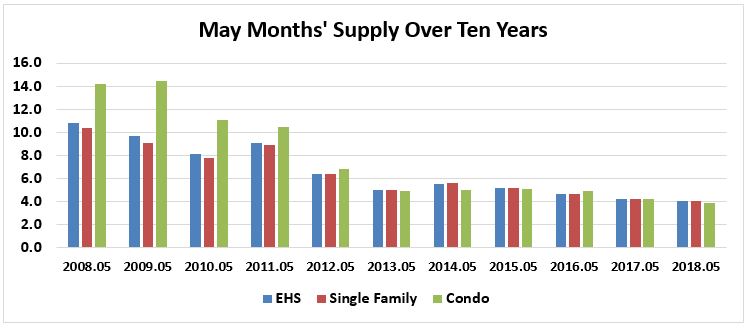
Months’ Supply. In May 2018, the U.S. had the fastest pace of homes sold relative to the inventory when months’ supply was 4.1 months. In 2008, the U.S. had the slowest relative pace when it would have taken 10.8 months to sell the supply of homes on the market at the prevailing sales pace. This was also the case for the condominium market, which had the biggest challenge in 2008 when it would have taken 14.2 months. Similarly, for 2008 single-family properties, it would have taken 10.4 months to sell all available inventory at the prevailing sales pace. The ten-year national May average months’ supply is 6.6, with single-family at 6.5 months’ supply and condominiums at 7.7 months’ supply.
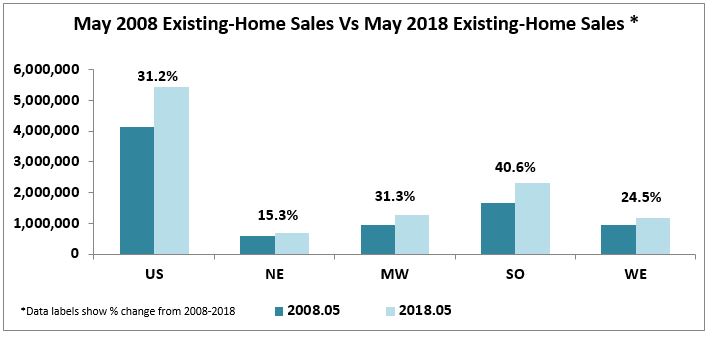
Existing-Home Sales. The total number of existing-homes sold (EHS) in the U.S. for May 2018 was higher than the ten-year May average. Regionally, the May 2018 sales in all four regions were above the ten-year May average, with the Midwest and South showing the highest percentage increase.
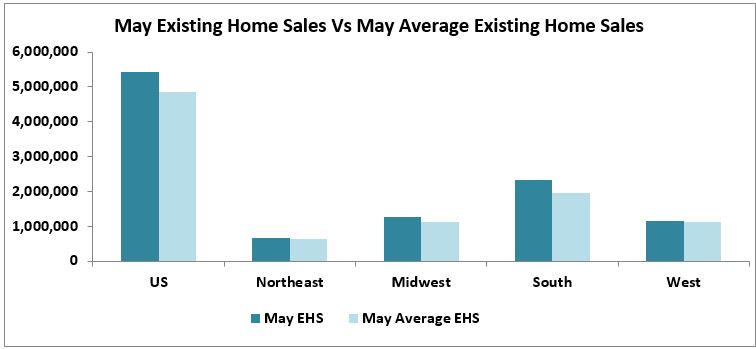
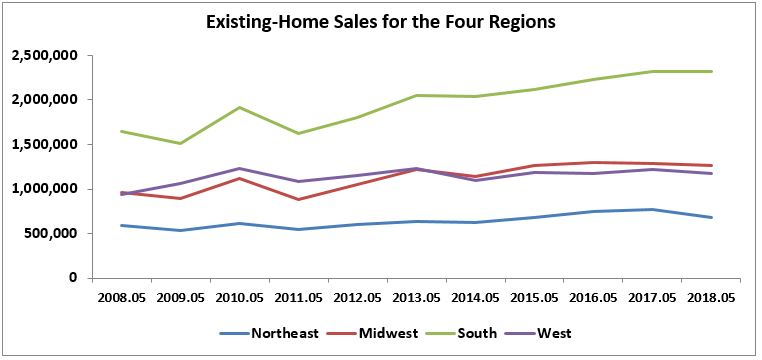
Comparing May of 2008 to May of 2018, there were 31.2 percent more homes sold in 2018 across the U.S. Regionally, the South led with the largest gain of 40.6 percent, followed by the Midwest with a gain of 31.3 percent. The West had an uptick in sales at 24.5 percent. The Northeast region’s sales advanced 15.3 percent over the ten-year period.
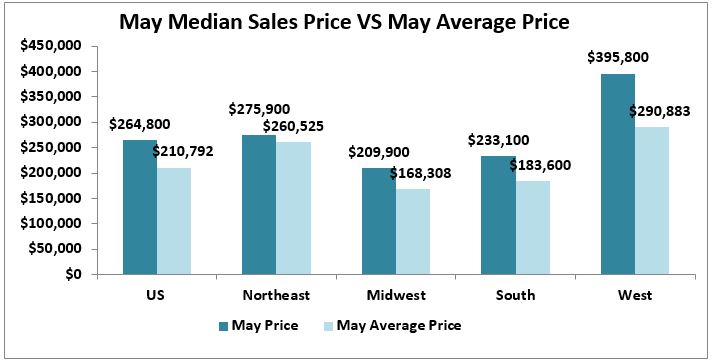
Along with noticeable increase in sales, the past ten years also registered steep increases in home prices, especially during the last five years. The trend is illustrated by the comparison between the latest median price and the 10-year average of median prices. The national May 2018 median home prices was $246,800, a 25.6 percent difference from the 10-year average. The comparison is reflected in similar fashion across all four regions, as well.
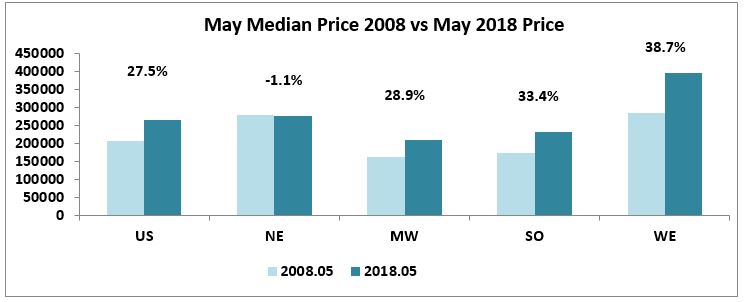
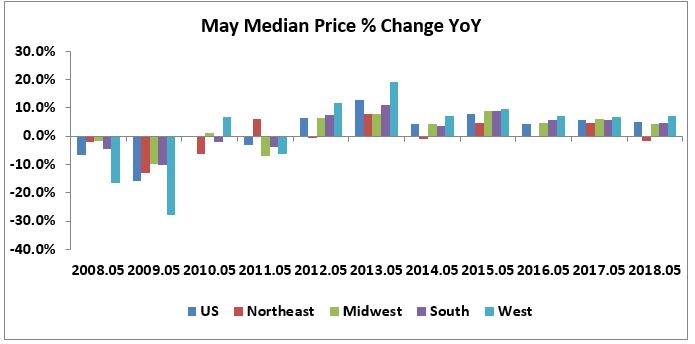
Median Home Prices. Comparing May of 2008 to May 2018, the median price of a home increased by 27.5 percent across the U.S., as well as in three of the four regions. The West led all regions with a gain of 38.7 percent followed by the South with 33.4 percent. The Midwest experienced a gain of 28.9 percent. The Northeast was the only region to experience a price decline, of 1.1 percent.
The year-over-year percentage change in median prices is a reminder that home prices were down in 2008 following the aftermath of the bubble and economic recession. In May 2008, prices were down across the U.S., with the West region posting the biggest drop falling 16.4 percent. The trend accelerated in 2009, when prices for the U.S. and the four regions reached the lowest point during this ten-year period, as the West prices fell 27.8 percent. The trend for median home prices began to turn upward in 2012, when all regions showed price gains, except the Northeast, which had a slight decline of 0.6 percent. The following year, 2013, price growth strengthened in the U.S. and the four regions with the West leading with a gain of 19.0 percent. Price growth has remained strong across the U.S. in the ensuing years. In May of this year, prices continued on an upward trend across all regions, except the Northeast. The West had the highest year over year price change compared to the U.S., at 7.2 percent vs. 4.9 percent, respectively. The Midwest registered a 4.2 percent advance, while the South posted a 4.5 percent gain. The Northeast recorded a 1.8 percent year-over-year decline in May 2018.
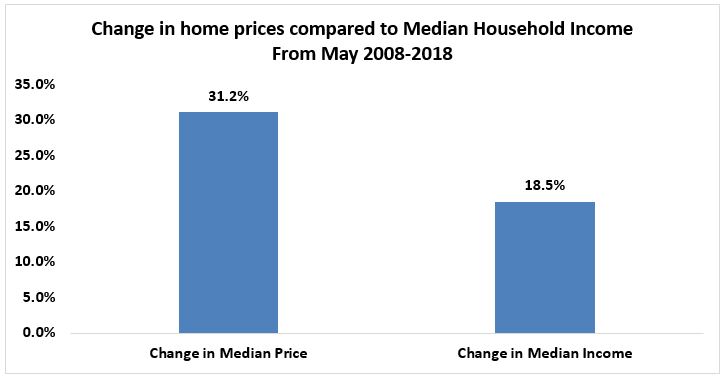
Median Family Incomes. Median family incomes continued to rise over the ten-year period and have risen to $75,312 as of May 2018. However, the increase in family incomes came at a slower pace than home prices. Median incomes grew 18.5 percent during the May 2008 – May 2018 period, compared to median prices which rose 32.1 percent.
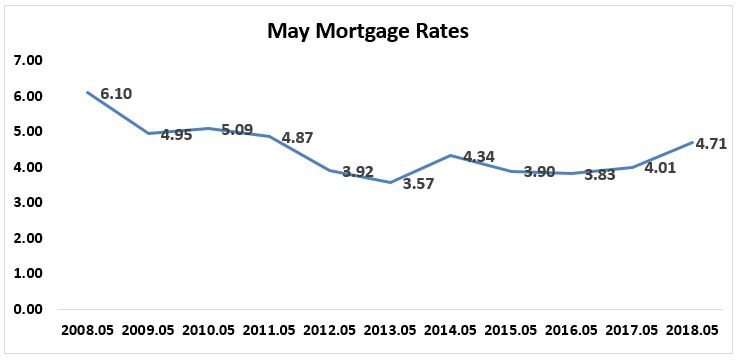
Mortgage Rates. Home sales have grown strongly over the past decade also due to a low interest rates environment. May mortgage rates have dropped favorably over the last ten May months. In 2008 rates had risen to 6.10 percent but fell to 4.95 percent by 2009. The ten-year average mortgage rate has been 4.48 percent and the rates are down 22.8 percent from ten years ago.
In summary the May housing market over the last ten years has seen home sales increase along with prices while inventory levels have been trending downward. The West has been leading all regions in prices while the South has been leading in home sales. The housing market has bounced back since the recession, job growth and the economy had recovered. Mortgage rates are on the rise while the pace of incomes are not keeping up with home prices. Population and job growth will need a steady supply of new and existing housing to assure that the dream of being a home owner can still come true.
[1] Based on the United Nations estimate as of July 12, 2018. https://www.census.gov/popclock/
