Homebuyers on a $2,500 Monthly Budget Can Afford $33,000 More With Low Mortgage Rates, But Higher Home Prices Cancel Out Increase
Historically low rates are motivating homebuyers even though prices were up 8.2% year over year in July, effectively cancelling out the 6.9% increase in purchasing power.
A homebuyer with a $2,500 monthly housing budget can afford a home priced $33,250 higher than a year ago, thanks to historically low mortgage rates. At a 3% mortgage interest rate—roughly the average 30-year fixed rate for July and August 2020—a homebuyer can afford a $516,500 home on $2,500 per month, up from the $483,250 they could afford on the same budget when the average was 3.77% in July 2019. To put it another way, the monthly payment on a $483,250 home has dropped from $2,500 a year ago to $2,339 today.
The $33,250 rise in purchasing power from last year (from $483,250 to $516,500) is a 6.9% increase. The 8.2% year-over-year home-price increase in July, the largest rise in more than two years, was higher. Historically low mortgage rates are responsible for both: They push up homebuyer demand, which leads to an uptick in home prices. Those are the intended results, as the Fed is using low interest rates to stimulate the economy during the pandemic-driven recession.
“Low mortgage rates are motivating many people to purchase a home, particularly those who want more space to work from home,” said Redfin chief economist Daryl Fairweather. “But because there hasn’t been an increase in the number of homes for sale since rates started dropping with the onset of the pandemic, many buyers end up competing for the same homes, driving up prices. Those competing forces make the current market a wash for many buyers looking for single-family homes in competitive areas. Buyers searching for condos can find a better deal, both on overall price and mortgage payments, because most condos are less competitive than single-family homes as people move out of densely populated urban areas.”
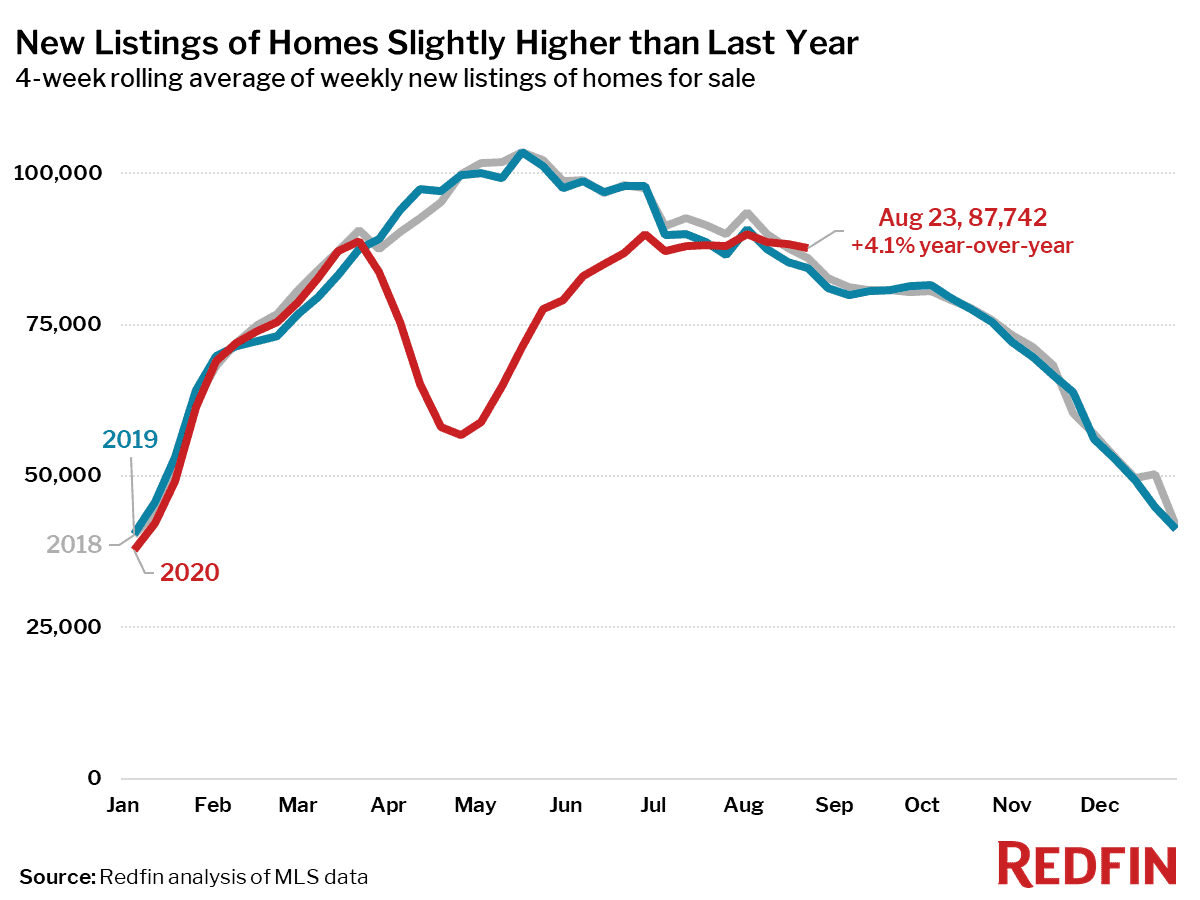
The continuing housing supply shortage means there are fewer homes for sale affordable for someone with a $2,500 monthly budget than last year. In July 2020, 70.6% of homes nationwide were affordable on that budget, down slightly from 71.9% in July 2019.
Interest rates are a primary motivator for today’s homebuyers
Even though the uptick in home prices ultimately cancels out the increase in purchasing power brought on by low rates, 55% of people who are moving for pandemic-related reasons said low mortgage rates are a factor in their homebuying plans. That’s according to a survey of more than 1,000 people who plan to buy a home within the next 12 months conducted by Redfin in July.
“I’m getting a lot of first-time buyers who are excited because they can finally afford a home,” said Chriss Houghton, a Redfin agent in Vancouver, WA, located 10 miles north of Portland, OR across the state border. The typical home in Vancouver sold for $385,000 in July versus $470,000 in the city of Portland, and the more affordable housing combined with no state income tax in Washington make it an attractive option, particularly for people who can now work remotely. “People who could afford $300,000 before can now afford nearly $350,000, and the difference is a huge motivator. For some families in neighborhoods without fierce competition, the uptick in buying power allows them to purchase bigger houses with more land where more than one generation can live.”
The interactive chart below shows how much a homebuyer can afford to spend at different mortgage interest rates, with each line representing a different monthly payment.
Despite bigger budgets, buyers have fewer options in many metros
“Back in June, homebuyers thought they could take advantage of low rates and get a good deal because of the pandemic,” said Providence, RI Redfin agent Lisa Bernardeau. “Now they’re seeing that’s not the case because inventory is so tight and there’s so much competition, but most buyers are still powering through. Regardless of high prices, a lot of buyers have been watching the market and they don’t want to miss out on historically low rates or risk prices going even higher. Low interest rates are the number one driver right now.”
There were fewer homes for sale on a $2,500 monthly budget than last year in the majority of metros included in this report, including Providence, where 74.4% of homes are affordable on that budget now versus 75.9% (-1.5 percentage points) in July 2019.
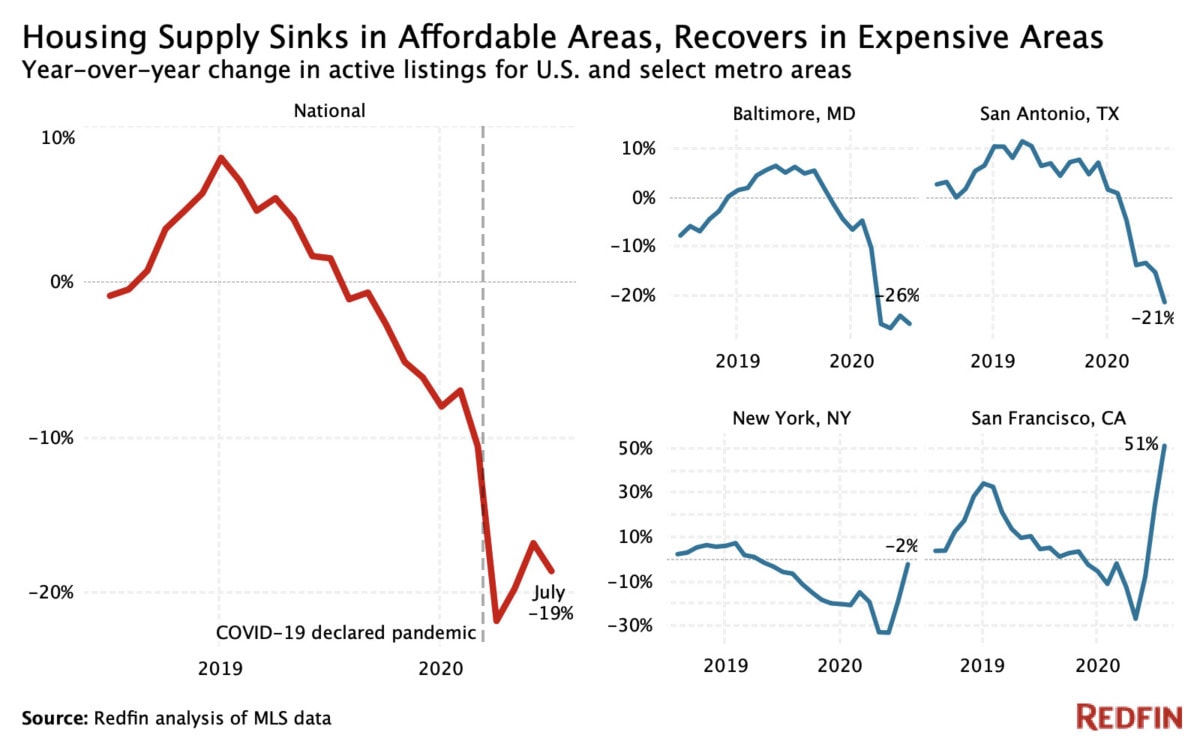
Salt Lake City (-5.2 percentage points), Kansas City (-3.7), Austin (-3.2) and Boston (-3) saw the biggest declines in the share of affordable homes for sale. Miami (+2.1), Jacksonville (+2), Columbus (+2) and Milwaukee (+2) experienced the biggest increases.
Share of homes for sale affordable on a $2,500 monthly mortgage budget
| Metro area | Change in share of homes affordable, July 2019 to July 2020 | Share of homes affordable on a $2,500 payment, July 2020 | Share of homes affordable on a $2,500 payment, July 2019 | Year-over-year change in number of homes for sale (July 2020) | Year-over-year change in median sale price (July 2020) |
|---|---|---|---|---|---|
| Miami, FL | 2.1 pts | 61.5% | 59.3% | -8.3% | 7.9% |
| Jacksonville, FL | 2.0 pts | 84.1% | 82.0% | -16.8% | 8.2% |
| Columbus, OH | 2.0 pts | 88.0% | 86.0% | -14.8% | 10.9% |
| Milwaukee, WI | 2.0 pts | 86.1% | 84.1% | -7.8% | 14% |
| Raleigh, NC | 1.8 pts | 80.4% | 78.6% | -13.4% | 6.8% |
| New York, NY | 1.6 pts | 32.0% | 30.4% | -1% | 1% |
| Virginia Beach, VA | 1.3 pts | 88.6% | 87.2% | -26.3% | 10% |
| San Jose, CA | 1.0 pts | 3.7% | 2.7% | -12.9% | 6.7% |
| San Francisco, CA | 0.8 pts | 2.1% | 1.3% | 50.9% | 3.5% |
| Baltimore, MD | 0.7 pts | 76.6% | 75.9% | -26% | 6.8% |
| Minneapolis, MN | 0.6 pts | 78.9% | 78.3% | -14.4% | 9.8% |
| Orlando, FL | 0.6 pts | 83.0% | 82.4% | -11.8% | 8.5% |
| San Diego, CA | 0.6 pts | 23.9% | 23.3% | -22.7% | 10.3% |
| Sacramento, CA | 0.5 pts | 53.4% | 52.9% | -22.7% | 10.7% |
| Louisville, KY | 0.5 pts | 86.9% | 86.4% | -22.6% | 9.3% |
| Chicago, IL | 0.4 pts | 76.5% | 76.2% | -17.6% | 7.4% |
| Atlanta, GA | 0.4 pts | 80.2% | 79.8% | -18.6% | 9% |
| Dallas, TX | 0.3 pts | 76.6% | 76.3% | -21.4% | 8% |
| Detroit, MI | 0.3 pts | 93.1% | 92.8% | -18.1% | 13.8% |
| Denver, CO | 0.2 pts | 55.1% | 54.9% | -14.1% | 7% |
| Hartford, CT | 0.0 pts | 88.5% | 88.5% | -20.5% | 9.2% |
| Cincinnati, OH | 0.0 pts | 87.8% | 87.8% | -15.7% | 13.3% |
| Cleveland, OH | -0.1 pts | 91.2% | 91.3% | -30.2% | 2.9% |
| Pittsburgh, PA | -0.2 pts | 88.9% | 89.1% | -4.1% | 9.4% |
| Portland, OR | -0.2 pts | 58.7% | 59.0% | -21.5% | 8.6% |
| Birmingham, AL | -0.3 pts | 87.1% | 87.4% | -24% | 16.8% |
| San Antonio, TX | -0.5 pts | 86.3% | 86.8% | -23.9% | 8.8% |
| Buffalo, NY | -0.5 pts | 92.3% | 92.8% | -23.5% | 6.5% |
| Seattle, WA | -0.5 pts | 30.4% | 30.9% | -16.9% | 11.2% |
| Richmond, VA | -0.5 pts | 83.1% | 83.6% | -24.7% | 9.1% |
| Tampa, FL | -0.6 pts | 82.4% | 83.0% | -23.4% | 10.7% |
| Memphis, TN | -0.6 pts | 86.9% | 87.6% | -25.2% | 5.3% |
| Houston, TX | -0.7 pts | 80.6% | 81.3% | -17.3% | 8.2% |
| Oklahoma City, OK | -0.8 pts | 88.2% | 89.0% | -16.2% | 11.3% |
| Nashville, TN | -1.0 pts | 74.3% | 75.3% | -15.6% | 9.1% |
| Indianapolis, IN | -1.1 pts | 86.5% | 87.6% | -28.1% | 12.5% |
| St. Louis, MO | -1.3 pts | 87.9% | 89.2% | -37% | 13.2% |
| Providence, RI | -1.5 pts | 74.4% | 75.9% | -24.8% | 10.2% |
| Las Vegas, NV | -1.7 pts | 81.1% | 82.8% | -20.7% | 8.8% |
| Charlotte, NC | -1.7 pts | 79.4% | 81.2% | -28.1% | 8.6% |
| Los Angeles, CA | -1.8 pts | 18.6% | 20.4% | -16.7% | 7.7% |
| Riverside, CA | -2.1 pts | 64.8% | 66.9% | -29.9% | 10.5% |
| New Orleans, LA | -2.3 pts | 80.3% | 82.6% | -15.9% | 11.3% |
| Phoenix, AZ | -2.6 pts | 73.3% | 75.9% | -17.2% | 13.5% |
| Philadelphia, PA | -2.6 pts | 80.7% | 83.3% | -6.9% | 10.6% |
| Washington, D.C. | -2.9 pts | 55.1% | 58.0% | -13.6% | 11.4% |
| Boston, MA | -3.0 pts | 35.6% | 38.7% | -11.9% | 4.7% |
| Austin, TX | -3.2 pts | 70.5% | 73.7% | -18.4% | 10.9% |
| Kansas City, MO | -3.7 pts | 83.1% | 86.8% | -52.2% | 10.1% |
| Salt Lake City, UT | -5.2 pts | 64.0% | 69.1% | -51.7% | 9.2% |
| National | -1.3 pts | 70.6% | 71.9% | -21.8% | 8.2% |
Methodology
The home prices listed in the interactive chart and examples above are calculated based on the maximum loan a buyer could pay with the given monthly payments, assuming a 20% down payment plus property taxes (1.25% rate) and insurance (annual premium 0.5% of home value). HOA dues were not included in the calculations. For the recent period, we used a mortgage rate of 3%. For the July 2019 period, we used a mortgage rate of 3.77%.
The post Homebuyers on a $2,500 Monthly Budget Can Afford $33,000 More With Low Mortgage Rates, But Higher Home Prices Cancel Out Increase appeared first on Redfin | Real Estate Tips for Home Buying, Selling & More.