Sales of New Homes Down 8% in January
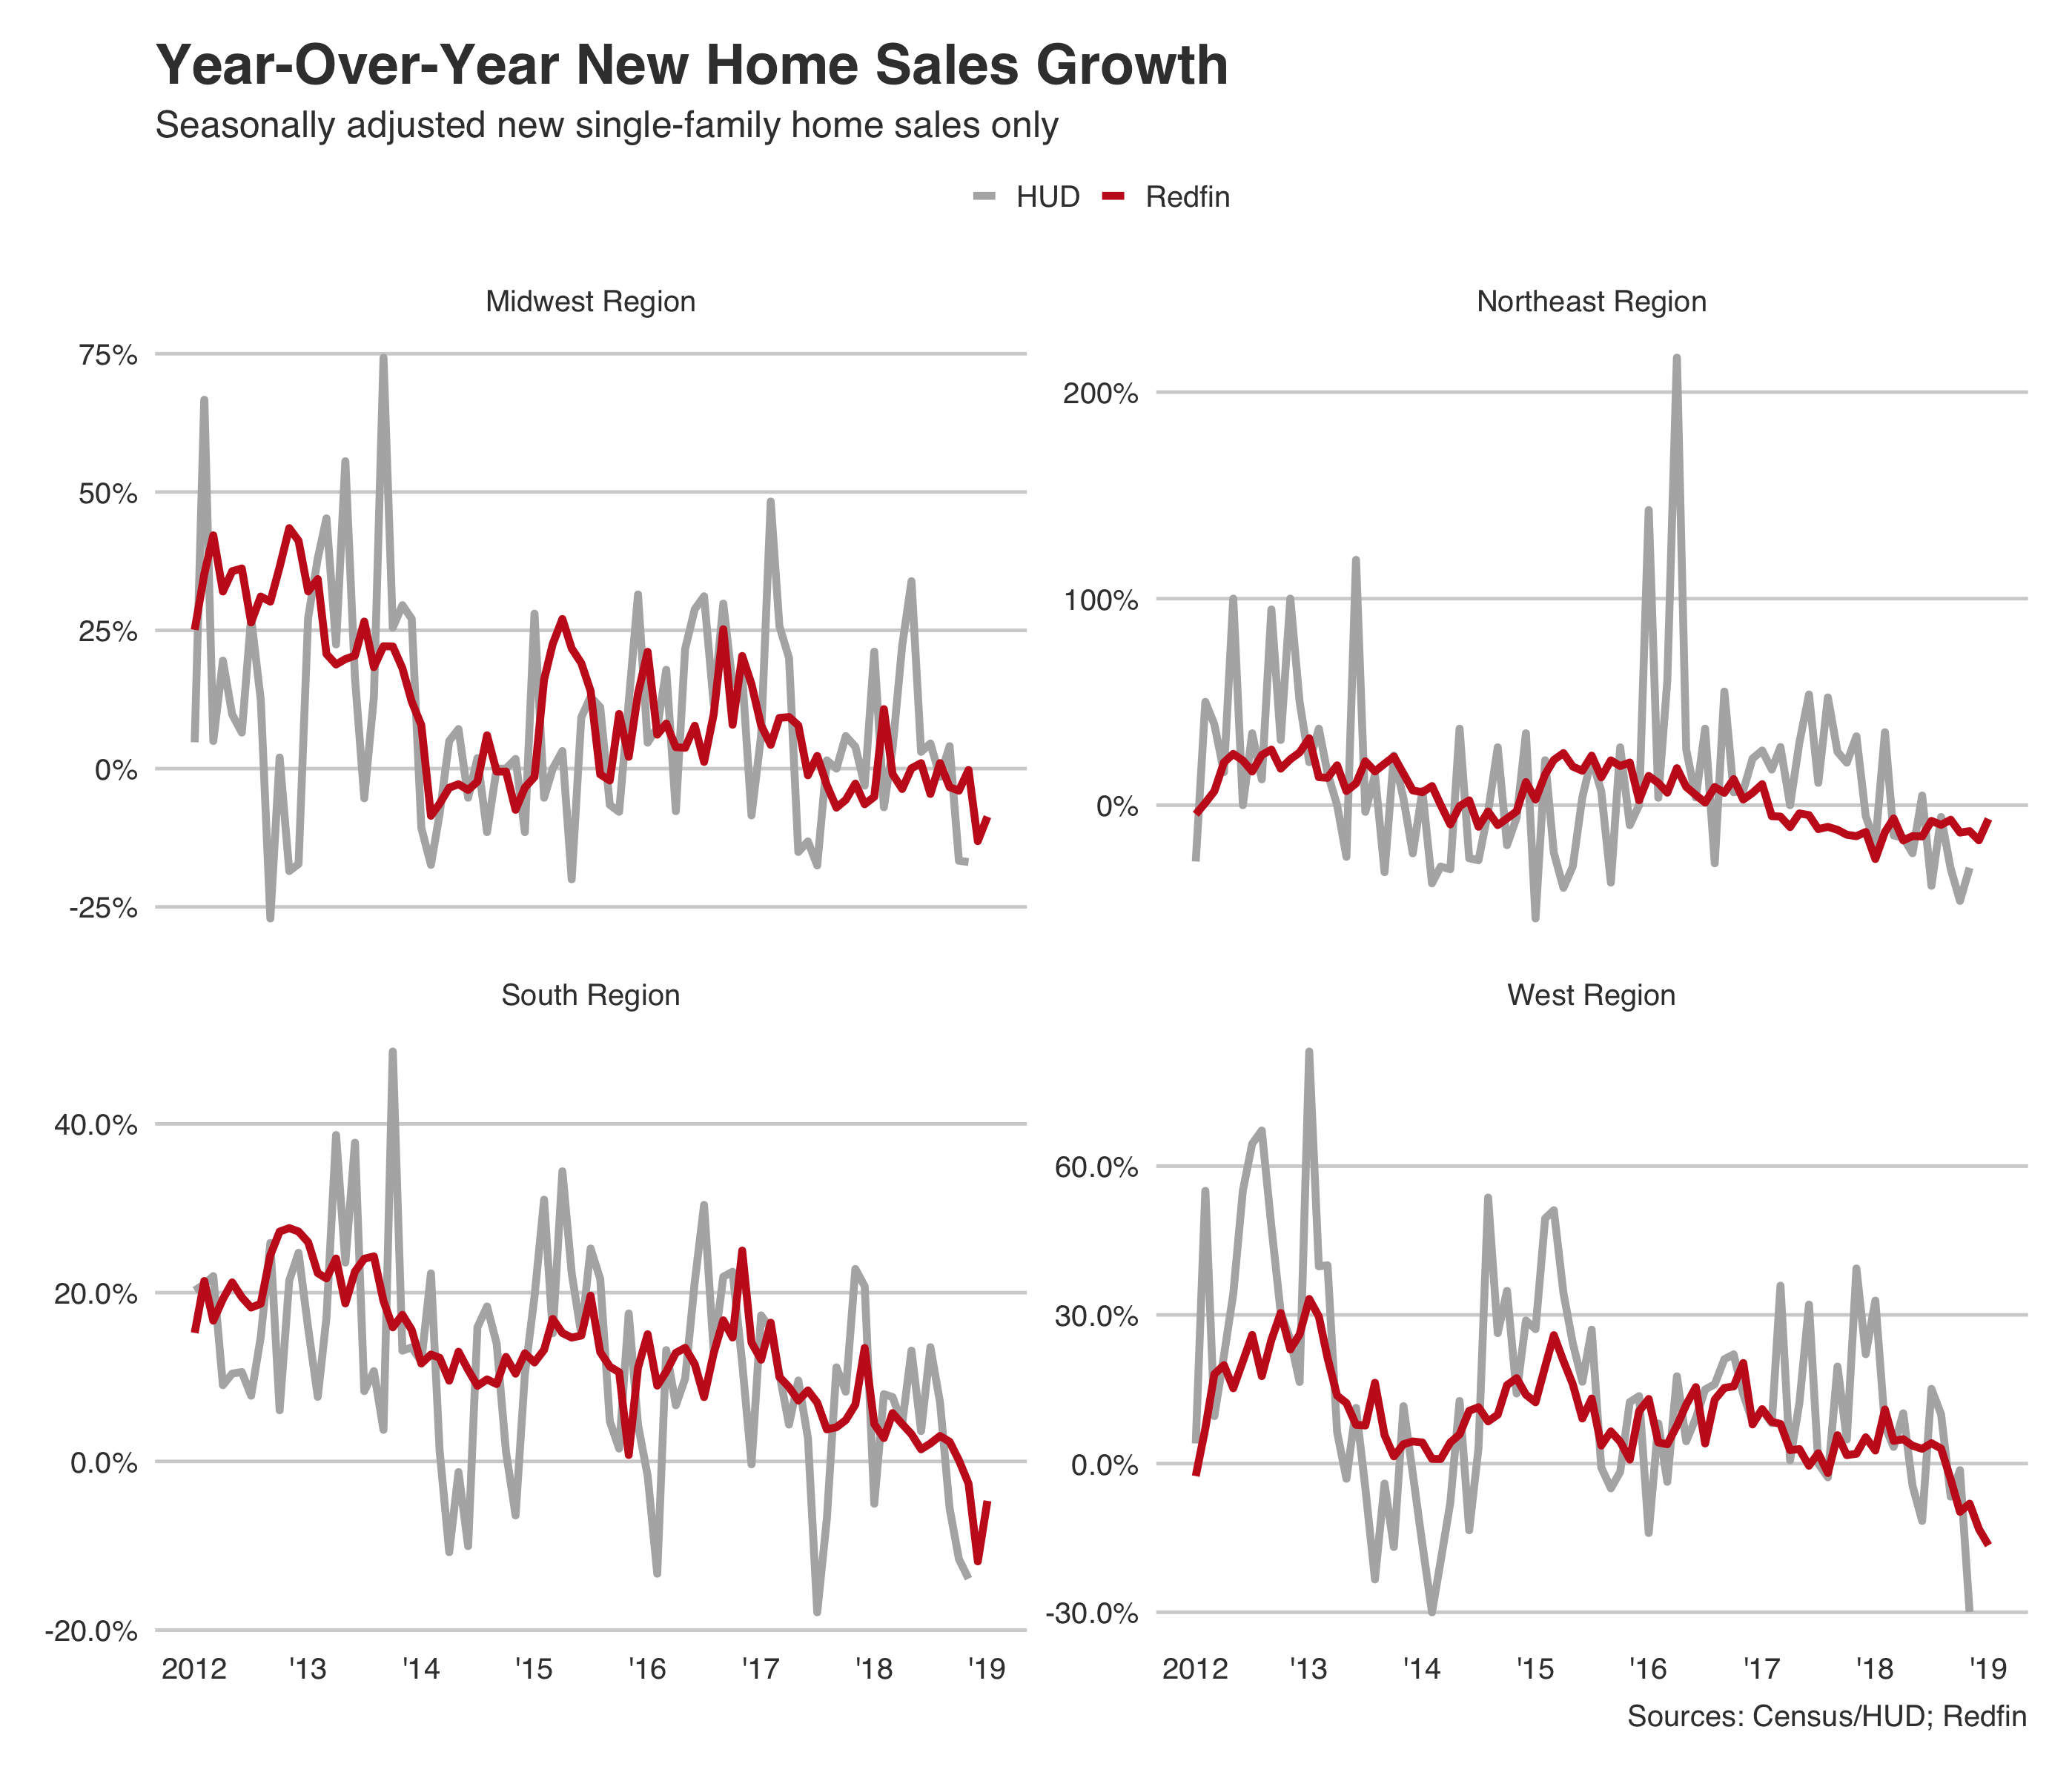
New-home sales fell year over year in all four major U.S. regions.
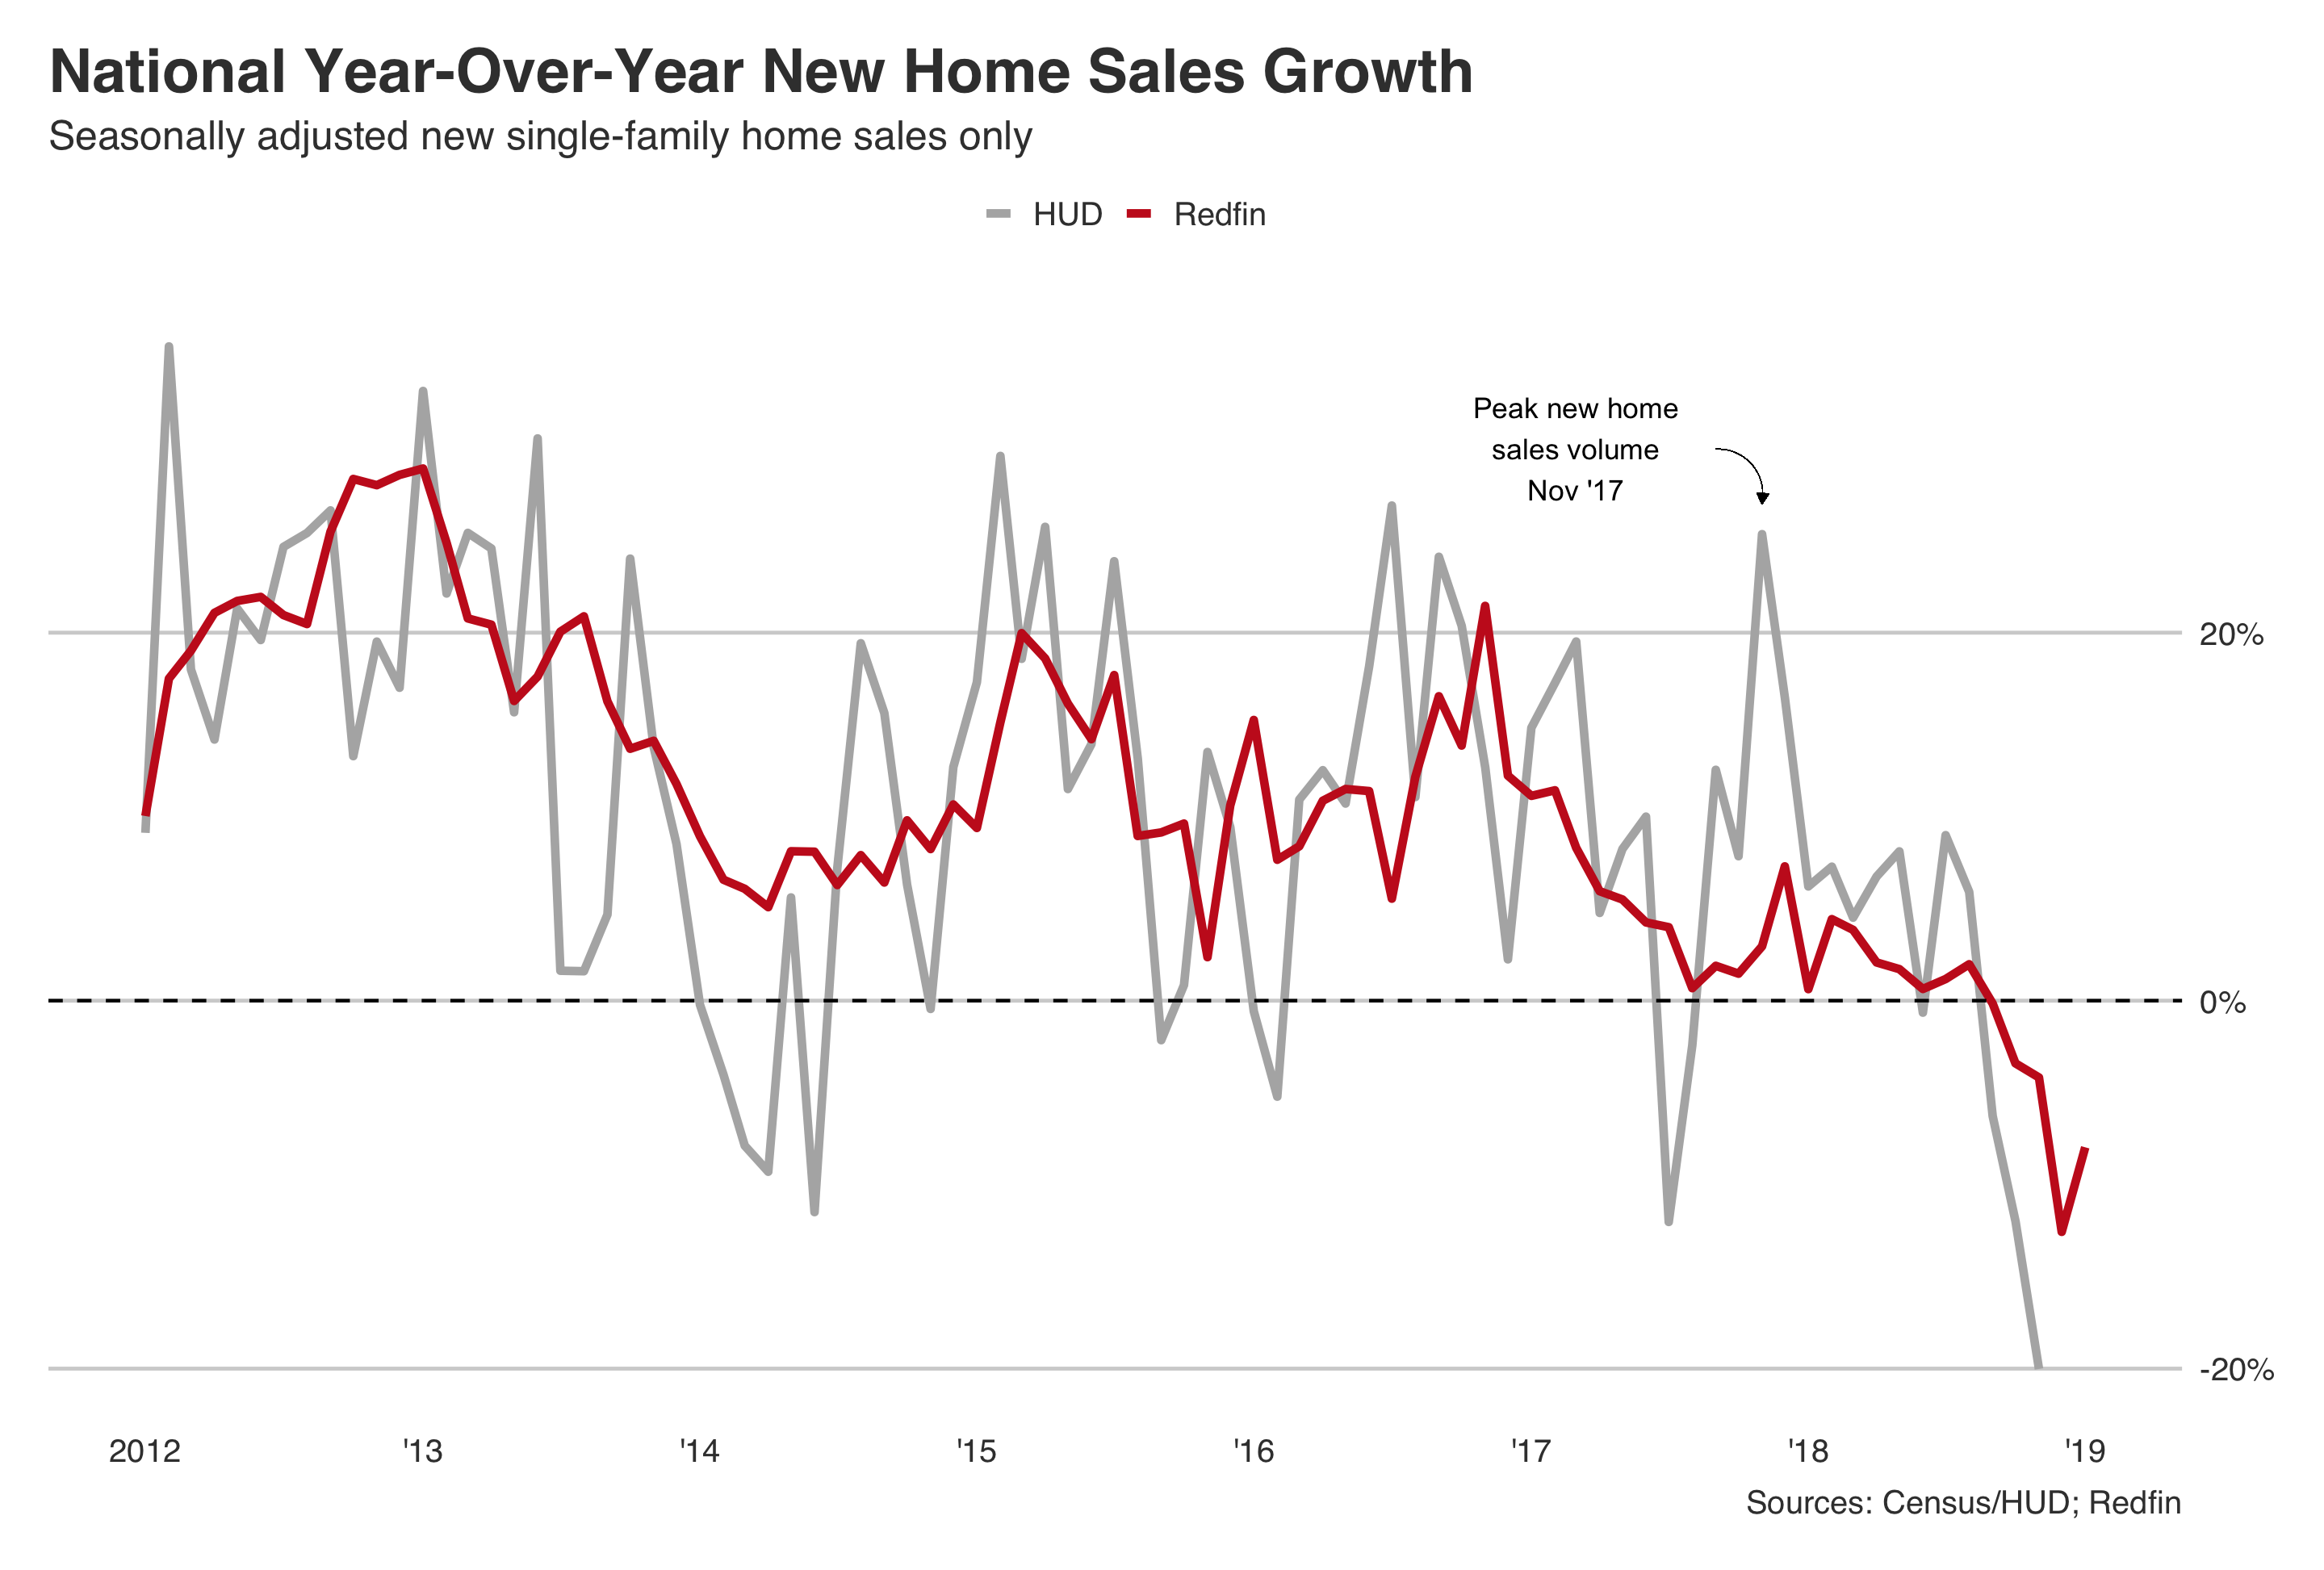
Sales of new single-family homes fell 8 percent year over year in January, the fifth consecutive month of year-over-year declines in new-home sales. But the size of the drop was smaller than in December in all regions except the West, where sales fell by more in January than they did the month before.
Here’s a look at the annual drop in single-family new-home sales in January 2019, plus the final two months of last year (seasonally adjusted):
| Region | YoY Change in New-Home Sales (Nov. 2018) | YoY Change in New-Home Sales (Dec. 2018) | YoY Change in New-Home Sales (Jan. 2019) |
| Midwest | -0.3% | -13.1% | -8.7% |
| Northeast | -12.6% | -17% | -6.6% |
| South | -2.6% | -11.8% | -4.7% |
| West | -8.1% | -13.2% | -16.5% |
| National | -4.2% | -12.6% | -8% |
The trend in new residential sales over the past few months has been similar to that of home sales overall, which fell 7.6 percent year over year in January, the sixth consecutive month of declines.
On a month-over-month basis, sales of new single-family homes nationwide dropped 0.2 percent in January.
New-Home Sales Data from Redfin (January 2019)
| Region | Median Sale Price – New Homes – January | YoY Change – Median Sale Price – New Homes | YoY Change – Inventory – New Homes | Months of Supply – New Homes |
| Midwest | $343,160 | 4% | 8.3% | 10.6 |
| Northeast | $479,950 | 6.8% | -1.9% | 11.7 |
| South | $291,000 | 0.3% | -1.2% | 8.1 |
| West | $435,120 | 1.4% | 0.7% | 6.9 |
| National | $339,000 | 1.2% | 0.2% | 8.3 |
“The shrinking size of sales declines, paired with falling interest rates, may be helping to improve builder confidence, which has been on the rise since December,” said Daryl Fairweather, chief economist at Redfin, the tech-powered real estate brokerage. “Still, buyers understand that the market is shifting in their favor and have become more sensitive to high home prices. That added sensitivity could continue to put a damper on the sales of new homes, which tend to be more expensive than comparable existing ones.”
The numbers above are based on Redfin data that covers more than 150 U.S. markets. The U.S. Department of Housing and Urban Development (HUD), in conjunction with the Census, typically reports monthly data on new-home sales, including year-over-year growth in sales and the statistics listed in the table above. Due to the partial government shutdown from December 22 to January 25, the data for the end of 2018 and the first month of 2019 hasn’t been released. Redfin released November and December 2018 and January 2019 data on single-family new-home sales to bridge the gap as the effects of the shutdown continue. The charts below illustrate that overall, Redfin and HUD data show similar trends in new-home sales.
Check out the Redfin data center for more information on the housing market.
The post Sales of New Homes Down 8% in January appeared first on Redfin Real-Time.