Seattle and Honolulu Move up the Ranks of the Best Cities for Public Transit in 2018
New York, San Francisco and Boston top the list of the 10 best cities for public transit according to the updated Transit Score® rankings by Redfin. Transit Score, a tool by Redfin company Walk Score®, rates locations based on how convenient they are to public transportation. Each of the top three cities has a Transit Score above 70, meaning it has an excellent transit rating, with transit being a convenient option for most trips.
While the rank order for the six best cities for public transit has stayed the same since 2012 when Transit Score first launched, there was a lot of movement at the bottom of the top-10 list.
In 7th place, Seattle has a Transit Score of 59.6, up 2.6 points since 2016, the biggest jump among the top 10. In the past two years, Seattle has expanded its Link light rail service, adding two new stations in 2016, making it easier and faster to get to Capitol Hill and the University of Washington. A 2017 survey by the Seattle Department of Transportation found that public transit use had increased by 48 percent in the past seven years.
“Seattle is not only the coolest city in the country – we are now one of the most transit-friendly cities,” said Seattle Mayor Jenny Durkan. “For our visitors, commuters and residents, public transit is safe, affordable, and a vital component in making sure our city is accessible to all. With the opening of new light rail stations and one of the highest bus riderships in the country, Seattle is making significant strides towards becoming a world-class transit city.”
Honolulu gained 1.6 points of Transit Score since 2016 and entered the top 10 list for the first time, replacing Miami. More than 69 million passengers in Honolulu ride TheBus annually and the city is planning a new rail system to further improve public transportation.
“Honolulu has been a public transportation city for many years now and the fact that our residents and visitors use TheBus an average of 214,000 trips every weekday is a testament to this fact,” said Honolulu Mayor Kirk Caldwell. “The new Transit Score ranking announced today by Redfin is proof that the nearly 2,000 workers who keep our bus system running strive for excellence each and every day, and our commitment to a transit system that covers all of O‘ahu will only improve once our rail project begins service along our busiest and most populated corridor.”
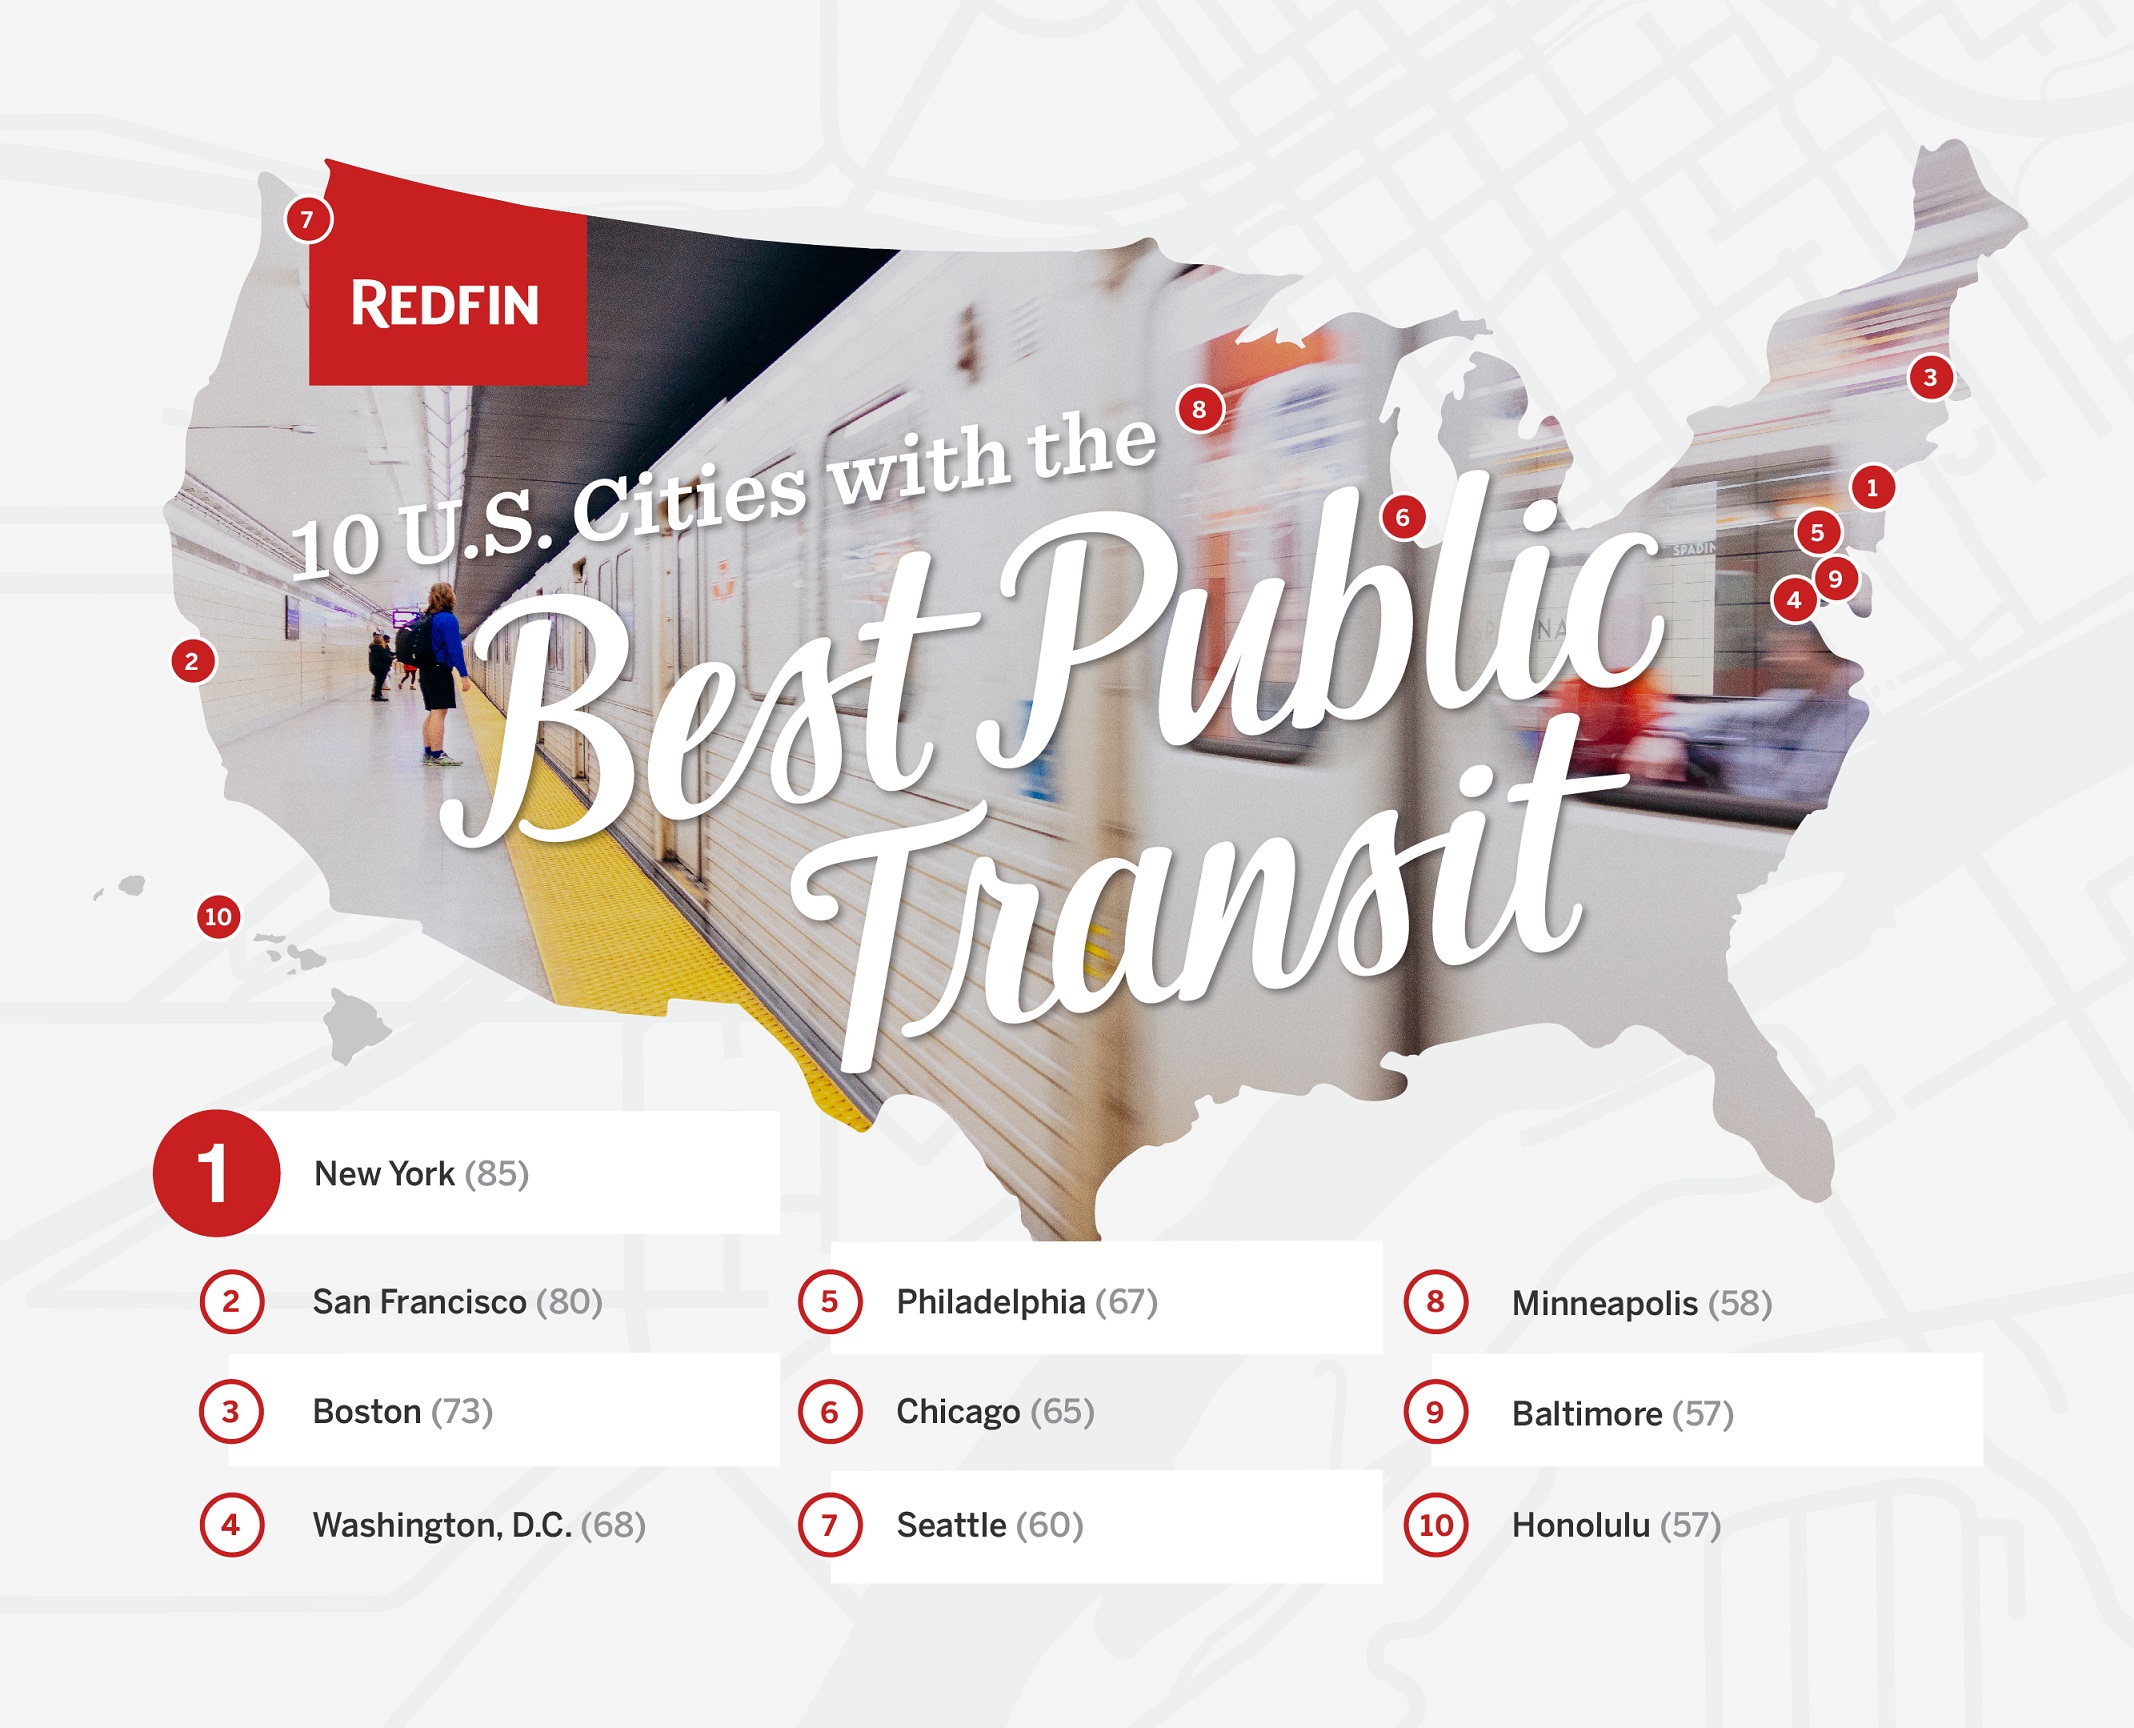
Below is a ranking of the top 10 U.S. cities (with populations of more than 300,000) for public transit.
| Rank | City | Transit Score | Change from 2016 | Previous Rank (2016) |
| 1 | New York | 85.3 | +1.2 | 1 |
| 2 | San Francisco | 80.4 | 0 | 2 |
| 3 | Boston | 72.6 | -1.8 | 3 |
| 4 | Washington, D.C. | 68.5 | -2.2 | 4 |
| 5 | Philadelphia | 66.8 | +0.1 | 5 |
| 6 | Chicago | 65.0 | +0.3 | 6 |
| 7 | Seattle | 59.6 | +2.6 | 10 |
| 8 | Minneapolis | 57.6 | 0 | 9 |
| 9 | Baltimore | 57.2 | -0.6 | 8 |
| 10 | Honolulu | 57.2 | +1.7 | 11 |
Top 5 Biggest Transit Score Increases
Raleigh, NC had the largest Transit Score increase, up 6.3 points from 2016 to 28.9 this year.
Rounding out the top five places with the largest Transit Score increases are Phoenix, AZ (+3.8), Aurora, CO (+3.5), Seattle, WA (+2.6) and Atlanta, GA (+1.7).
Top 5 Biggest Transit Score Decreases
Washington D.C. had the largest decrease among all major cities in Transit Score, dropping 2.2 points to 68.5 in 2018. The decrease can be attributed to changes in Metrobus and Metrorail scheduling, where some bus routes were discontinued and the frequency of trains during rush hour was lowered.
“Once touted as the gold standard for public transit, D.C.’s Metro is now reckoning with decades of deferred maintenance,” said Redfin Washington D.C. agent John Marcario. “Tough decisions to reduce service and shut down lines for extended periods for repair are causing short-term frustration, but will hopefully make the system better in the long run. Despite the fall in Transit Score, access to transit remains a top priority for D.C. home buyers, who are still willing to pay a premium to live near a metro station.”
Bakersfield, CA (-2.2), Miami FL (-2.2), Boston, MA (-1.8) and Baltimore, MD (-0.6) rounded out the cities with the biggest Transit Score decreases from 2016 to 2018.
New Cities Added
With the addition of 600 new U.S. cities and more than 4,000 new neighborhoods, Transit Score ratings are now available for more than 900 cities and nearly 15,000 neighborhoods on walkscore.com. Among the newly added cities are big ones like Jacksonville, FL (22.4) and Charlotte, NC (27.4), along with smaller cities with Transit Score ratings like Hartford, CT (54.2) and Syracuse, NY (44.1).
To see how your home, neighborhood or city stacks up, search walkscore.com or Redfin.com.
The Transit Score algorithm calculates a score by summing the relative usefulness of public transit (bus, subway, light rail, ferry, etc.) routes near a given location. Usefulness is defined as the distance to the nearest stop on the route, the frequency of the route, and type of route (with twice as much weight given to heavy/light rail than to bus service). Transit Score is based on data published in General Transit Feed Specification (GTFS) format by transit agencies across the country. For a more details on the Transit Score methodology, click here.
The post Seattle and Honolulu Move up the Ranks of the Best Cities for Public Transit in 2018 appeared first on Redfin Real-Time.