Wealth Gains from Homeownership across Metro Areas in 2018
Homeownership has been associated with positive social outcomes[1], and is also the largest source of wealth among homeowning households. In 2016, the median net worth among homeowners was $231,400, with housing wealth making up 85 percent of wealth (average net housing wealth was $197,500).[2]
Housing wealth contributes positively to the homeowner’s and children’s economic condition, because home equity can be tapped for expenditures such as investing in another property (which can generate rental income), home renovation (which further increases the home value), a child’s college education, emergency or major life events, or expenses in retirement.[3]
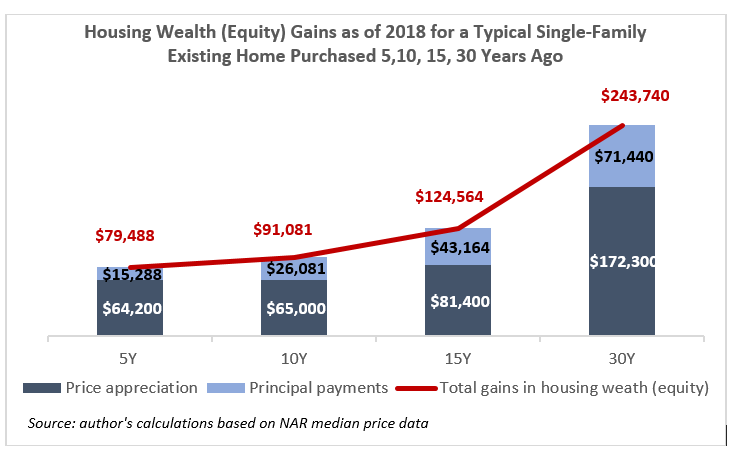
Housing wealth (or net worth or equity) is built up over time via the home price appreciation and the principal payments that the homeowner makes on the loan.[4] The chart shows the change in housing wealth (equity) as of 2018 for a home buyer who purchased a typical single-family existing home in the United States 5, 10, 15, or 30 years ago. Over these holding periods, most of the wealth gains are from the appreciation in home values. For example, if one purchased a home five year ago (2013), a home buyer would have typically gained $79,488 in wealth (equity), of which $64,200, or 81 percent is from the home price appreciation ($197,400 in 2013 to $261,600 in 2018). Homeowners who move typically do so in 10 years, so a homeowner who bought a home 10 years ago (2008) would have $91,081 in home equity gains as of 2018).[5] The longer the holding period, the larger the increase in wealth due to home price appreciation and the cumulative principal payments, which reduce the loan balance.
If you had purchased a home just five years ago in these metro areas, here are the typical gains in home equity that you have due to home price appreciation and the principal payments you’ve made[6]:
Metro areas with home equity gains of $200,000 or over for a home purchased 5 years ago:
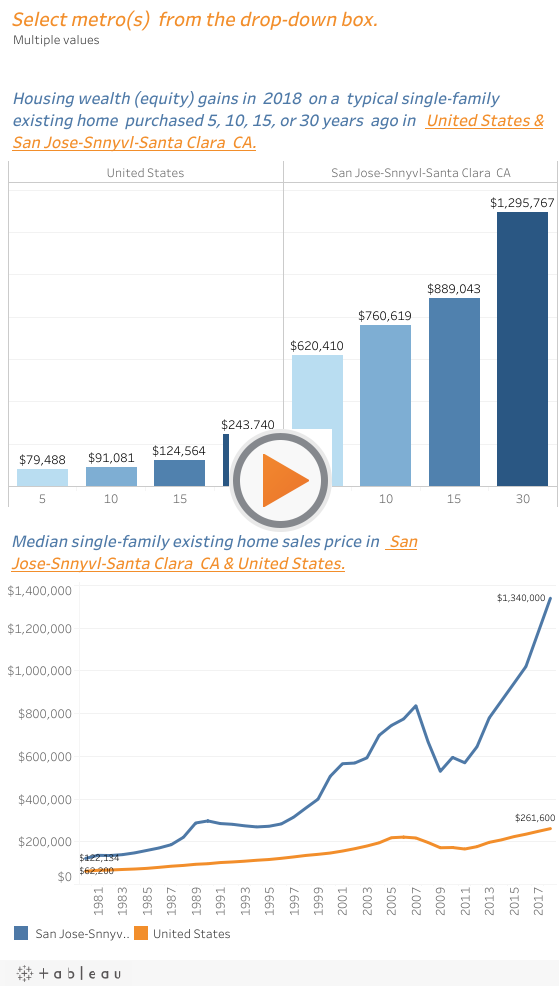
- San Jose-Sunnyvale-Sta. Clara: $620, 410
- San Francisco-Oakland-Hayward: $393,561
- Boulder, CO: $264,395
- Anaheim-Sta. Ana-Irvine, CA: $218,773
- Los Angeles-Long Beach-Glendale, CA: $216,613
- San Diego-Carlsbad, CA: $205,659
Metro areas with lowest equity gains (loss) for a home purchased 5 years ago:
- Atlantic City-Hammonton, NJ: ($8,593)
- New Jersey City-White Plains, NJ-NY: $3,336
- Cumberland, MB-WV: $6,215
- Trenton, NJ: $7943
- Elmira, NY: $8,705
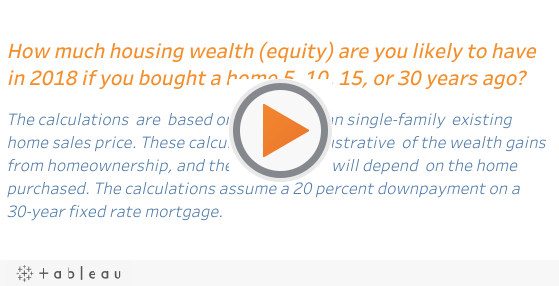
Use this data visualization to explore the typical increase in housing wealth across metro areas as of 2018 if you purchase a home 5, 10, 15, 30 years ago. These are typical gains and are illustrative of the magnitude of the wealth gains over time. Actual wealth gains will vary by property:

[1] Lawrence Yun and Nadia Evangelou, Social Benefits of Homeownership and Stable Housing, Realtor® University The Journal of the Center for Real Estate Studies; https://realtoru.edu/real-estate-studies/journal/
[2] Federal Reserve Board, 2016 Survey of Consumer Finances
[3] Brad Finkelstein, 7 reasons why consumers are tapping into home equity, The American Banker, June 26, 2018; https://www.americanbanker.com/7-reasons-why-homeowners-are-tapping-into-their-home-equity
[4] The price appreciation can be thought of as ‘capital gains’ while the principal payments can be thought of as a conversion from liquid asset (cash) to an illiquid asset (house).
[5] To be clear, these are changes in wealth or home equity between two time period or over n holding periods. If one wants the level of the home equity at a point in time, one has to add the down payment.
[6] These calculations are illustrative of the magnitude of the housing wealth gains; actual change in home equity will vary by home.