August 2018 Pending Home Sales
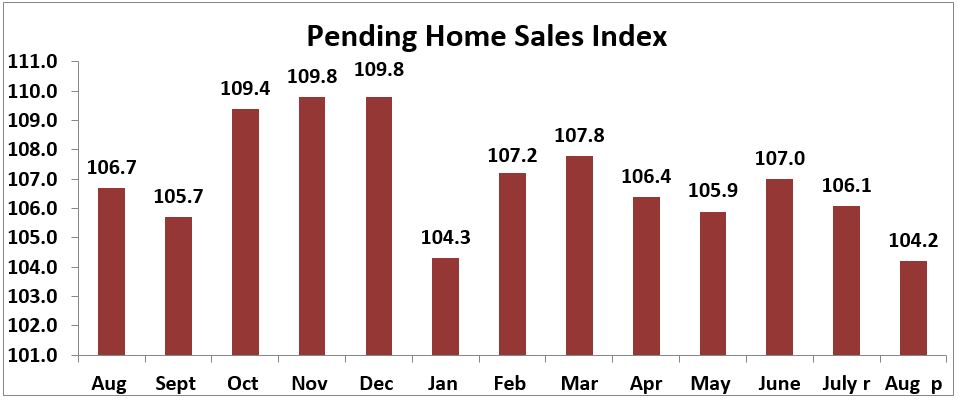
- NAR released a summary of pending home sales data showing that August’s pending home sales pace was down 1.8 percent last month and fell 2.3 percent from a year ago.
- Pending sales represent homes that have a signed contract to purchase on them but have yet to close. They tend to lead existing-home sales data by 1 to 2 months.
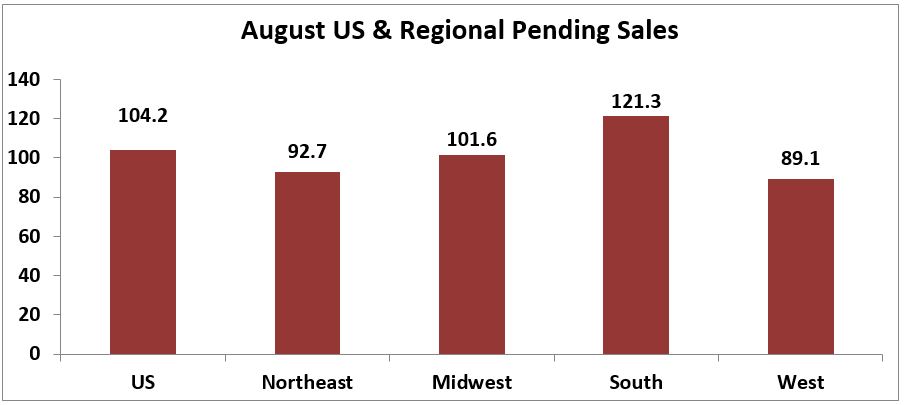
- Three of the four regions showed declines from a year ago. The South had the only incline in pending sales of 1.3 percent. The West had a very substantial drop in sales of 11.3 percent. The Northeast fell 1.6 percent followed by the Midwest with a decline of 1.1 percent.
- From last month, all four regions showed declines in sales. The Midwest region had the smallest drop of 0.5 percent followed by the South, which fell 0.7 percent. The Northeast had a decline of 1.3 percent followed by the West with the biggest drop of 5.9 percent.
- The U.S. pending home sales index level for the month was 104.2. July’s data was revised up to 106.1.
- In spite of the decline, this is the pending index’s 52nd consecutive month over the 100 level.
- The 100 level is based on a 2001 benchmark and is consistent with a healthy market and existing-home sales above the 5 million mark.
Recent Posts