January 2018 Pending Home Sales
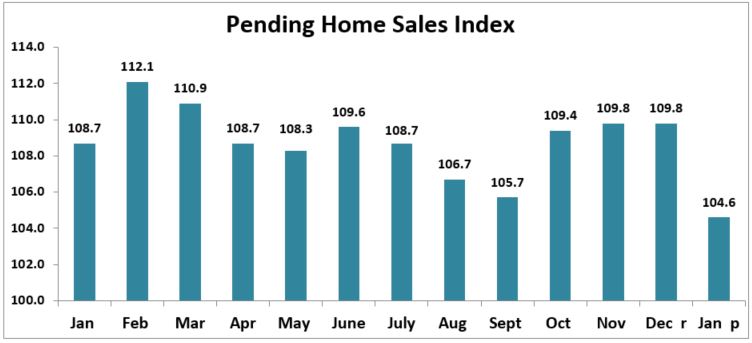
- NAR released a summary of pending home sales data showing that January’s pending home sales pace was down 4.7 percent last month and down 3.8 percent from a year ago.
- Pending sales represent homes that have a signed contract to purchase on them but have yet to close. They tend to lead existing-home sales data by 1 to 2 months.
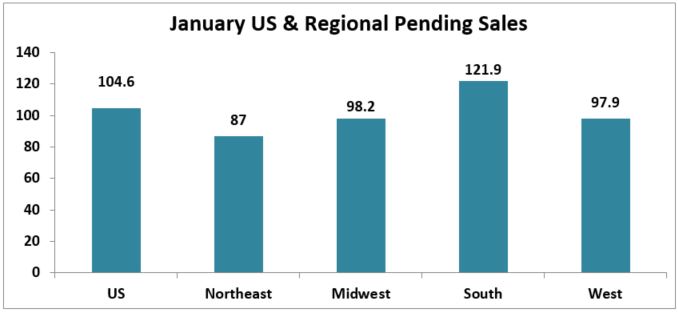
- All four regions showed declines from a year ago. The Northeast had the biggest drop in sales of 12.1 percent. The Midwest had a drop of 4.1 percent. The West declined 2.5 percent followed by the South that had a dip of 1.1 percent.
- From last month, all four regions showed declines in sales. The West had a decline of 1.2 percent followed by the South with the dip of 3.9 percent. The Midwest had a drop of 6.6 percent followed by the Northeast with the biggest decline of 9.0 percent.
- The U.S. pending home sales index level for the month was 104.6. December’s data was revised down slightly to 109.8.
- In spite of the decline, this is the pending index’s 45th consecutive month over the 100 level.
- The 100 level is based on a 2001 benchmark and is consistent with a healthy market and existing-home sales above the 5 million mark.
Recent Posts