March Home Prices Up 8.9%, the Biggest Increase in Four Years
The median home sale price increased 8.9 percent in March from a year ago, the highest price growth in four years. The median home sale price in March was $297,000 in the 174 markets that Redfin tracks.
The lack of homes for sale, down 11.9 percent year over year, continued to constrain sales, which declined 3.7 percent. The number of homes newly listed for sale in March fell 5.6 percent compared to a year ago.
“The Easter holiday fell early this year, which may have played a role in the decline in new March listings. Sellers are slow to list this year and we aren’t seeing enough new construction homes to fill the gap,” said Redfin chief economist Nela Richardson. “If we don’t see the new listings number turn around next month or a pickup in new housing starts, inventory will be a persistent drag on sales for the remainder of the year.”
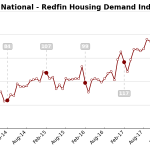
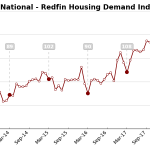
Though seller enthusiasm is waning, buyer demand is strong, making for a highly competitive market. The typical home went under contract in 43 days, eight days faster than a year earlier and faster than any March on record. Among homes that sold last month, 23.9 percent sold above their list price, up from 22.3 percent last March. One in five (20.5%) homes that sold in March went under contract within two weeks of their debut, compared to 18.4 percent last year.
Seattle was the fastest-moving market for the second month in a row, joined by Denver. Homes in these metros were on the market for a median of just seven days in March.
| Market Summary | March 2018 | Month-Over-Month | Year-Over-Year |
|---|---|---|---|
| Median sale price | $297,200 | 4.4% | 8.9% |
| Homes sold | 230,300 | 34.5% | -3.7% |
| New listings | 326,100 | 26.3% | -5.6% |
| All Homes for sale | 636,800 | 2.2% | -11.9% |
| Median days on market | 43 | -10 | -8 |
| Months of supply | 2.8 | -0.8 | -0.2 |
| Sold above list | 23.9% | 2.8% | 1.7% |
| Median Off-Market Redfin Estimate | $281,300 | -0.8% | 6.1% |
| Average Sale-to-list | 98.6% | 0.8% | 0.6% |
Strong price growth was not limited to hot coastal markets like San Jose, CA (32.3%) and San Francisco (16.7%). Places like Allentown, PA (21.8%), Detroit (20.6%) and Las Vegas (16.5%) are also experiencing strong price appreciation.
Inventory declined in 65 of the 73 most populous metros Redfin tracks below. In 48 of those metros, inventory fell more than 10 percent compared to last year. Baton Rouge, Washington, D.C., and Allentown bucked the declining inventory trend, respectively adding 26.6 percent, 11.8 percent and 11.4 percent to housing supply from last year.
Other March Highlights
Competition
- Denver, CO and Seattle, WA were the fastest markets, with half of all homes pending sale in just 7 days. San Jose, CA was the next fastest market with 9 median days on market, followed by Oakland, CA (12) and Sacramento, CA (13).
- The most competitive market in March was San Jose, CA where 83.2% of homes sold above list price, followed by 76.1% in San Francisco, CA, 75.2% in Oakland, CA, 59.8% in Seattle, WA, and 50.7% in Tacoma, WA.
Prices
- San Jose, CA had the nation’s highest price growth, rising 32.3% since last year to $1,263,500. Allentown, PA had the second highest growth at 21.8% year-over-year price growth, followed by Detroit, MI (20.6%), San Francisco, CA (16.7%), and Las Vegas, NV (16.5%).
- No metros saw price declines in March.
Sales
- Detroit, MI saw the largest decline in sales since last year, falling 18.7%. Home sales in Rochester, NY and Buffalo, NY declined by 14.6% and 13.1%, respectively.
- 2 out of 73 metros saw sales surge by double digits from last year. Milwaukee, WI led the nation in year-over-year sales growth, up 15.1%, followed by Albany, NY, up 10.3%. Allentown, PA rounded out the top three with sales up 6.1% from a year ago.
Inventory
- Inventory declined in 65 of the 73 metros Redfin tracks. In 48 of those metros, inventory fell by more than 10% compared to last year.
- Rochester, NY had the largest decrease in overall inventory, falling 42.6% since last March. Buffalo, NY (-42.4%), San Jose, CA (-41.5%), and Indianapolis, IN (-31.9%) also saw far fewer homes available on the market than a year ago.
- Baton Rouge, LA had the highest increase in the number of homes for sale, up 26.6% year over year, followed by Washington, DC (11.8%) and Allentown, PA (11.4%).
Pricing Strategy
- To see trends in sellers’ pricing strategies, we compare the list price to the Redfin Estimate, Redfin’s automated home-value estimate with the industry’s lowest published error rate for listed homes.
- The median list price-to-Redfin Estimate ratio was 93.5% in San Francisco, CA, the lowest of any market. This indicates sellers may be underpricing their homes to create a bidding war, as the typical home for sale in March was listed at a price 93.5% of its estimated value. Only 7.6% of homes in San Francisco, CA were listed for more than their Redfin Estimate.
- Conversely, the median list price-to-Redfin Estimate ratio was 102.5% in Miami, FL and 102.2% in West Palm Beach, FL, which means sellers in those metro areas are listing their homes for more than the estimated value. In Miami, FL, 84.3% of homes were listed above their Redfin Estimate, the highest percentage of any metro.
Below are market-by-market breakdowns for prices, inventory, new listings and sales for markets with populations of 750 thousand or more. For downloadable data on all of the markets Redfin tracks, visit the Redfin Data Center.
Median Sale Price
| Redfin Metro | Median Sale Price | Month-Over-Month | Year-Over-Year |
|---|---|---|---|
| Albany, NY | $200,800 | 8.4% | 9.2% |
| Allentown, PA | $201,000 | 14.9% | 21.8% |
| Atlanta, GA | $230,000 | 5.5% | 8.5% |
| Austin, TX | $301,400 | 0.9% | 2.2% |
| Bakersfield, CA | $225,000 | 0.2% | 6.1% |
| Baltimore, MD | $259,900 | 6.1% | 8.3% |
| Baton Rouge, LA | $197,500 | -1.0% | 9.8% |
| Birmingham, AL | $188,000 | -2.1% | 12.6% |
| Boston, MA | $462,500 | 6.0% | 7.6% |
| Buffalo, NY | $138,000 | 4.9% | 11.9% |
| Camden, NJ | $169,900 | 6.3% | 6.2% |
| Charlotte, NC | $237,100 | 5.6% | 4.4% |
| Chicago, IL | $240,000 | 6.7% | 6.7% |
| Cincinnati, OH | $174,500 | 10.2% | 10.4% |
| Cleveland, OH | $134,900 | -0.1% | 7.1% |
| Columbus, OH | $191,000 | 5.8% | 10.6% |
| Dallas, TX | $295,000 | 3.5% | 6.1% |
| Denver, CO | $401,800 | 0.7% | 9.2% |
| Detroit, MI | $120,000 | 4.3% | 20.6% |
| Fort Lauderdale, FL | $255,000 | 6.2% | 13.3% |
| Fort Worth, TX | $229,900 | 2.2% | 6.9% |
| Fresno, CA | $260,000 | -0.8% | 8.3% |
| Grand Rapids, MI | $187,000 | 3.9% | 9.2% |
| Greenville, SC | $200,000 | 5.9% | 12.2% |
| Hampton Roads, VA | $224,900 | 4.6% | 6.6% |
| Honolulu, HI | $558,000 | 1.5% | 7.8% |
| Houston, TX | $232,000 | 3.1% | 2.2% |
| Indianapolis, IN | $173,000 | 4.2% | 11.6% |
| Jacksonville, FL | $228,400 | 4.3% | 14.2% |
| Kansas City, MO | $205,000 | 8.0% | 10.6% |
| Knoxville, TN | $195,000 | 5.1% | 11.4% |
| Las Vegas, NV | $265,000 | 3.5% | 16.5% |
| Long Island, NY | $425,000 | 4.3% | 11.8% |
| Los Angeles, CA | $600,000 | 1.3% | 8.1% |
| Louisville, KY | $175,000 | 2.9% | 6.7% |
| Memphis, TN | $169,000 | 5.6% | 9.0% |
| Miami, FL | $300,000 | 9.1% | 11.1% |
| Milwaukee, WI | $195,000 | 14.0% | 5.4% |
| Minneapolis, MN | $258,000 | 3.2% | 11.2% |
| Montgomery County, PA | $295,000 | 3.5% | 10.1% |
| Nashville, TN | $281,500 | 2.4% | 8.3% |
| New Orleans, LA | $200,000 | -4.8% | 1.0% |
| Oakland, CA | $720,000 | 8.3% | 10.8% |
| Oklahoma City, OK | $165,000 | 0.6% | 3.1% |
| Omaha, NE | $185,700 | 4.3% | 9.3% |
| Orange County, CA | $710,000 | 2.2% | 9.2% |
| Orlando, FL | $236,000 | 1.5% | 7.3% |
| Oxnard, CA | $579,000 | 0.7% | 2.5% |
| Philadelphia, PA | $194,500 | 9.0% | 14.8% |
| Phoenix, AZ | $255,000 | 0.0% | 8.5% |
| Pittsburgh, PA | $159,900 | 5.9% | 14.3% |
| Portland, OR | $387,800 | 2.1% | 9.5% |
| Providence, RI | $253,200 | 2.9% | 12.5% |
| Raleigh, NC | $280,000 | 1.8% | 6.9% |
| Richmond, VA | $240,000 | 7.1% | 6.7% |
| Riverside, CA | $355,000 | 0.6% | 6.9% |
| Rochester, NY | $129,400 | 3.1% | 2.7% |
| Sacramento, CA | $385,000 | 3.6% | 10.0% |
| Salt Lake City, UT | $310,000 | 3.3% | 10.7% |
| San Antonio, TX | $214,900 | 3.3% | 7.5% |
| San Diego, CA | $558,500 | 2.5% | 7.4% |
| San Francisco, CA | $1,400,000 | 1.6% | 16.7% |
| San Jose, CA | $1,263,500 | 7.1% | 32.3% |
| Seattle, WA | $557,500 | 4.8% | 15.0% |
| St. Louis, MO | $166,900 | 1.2% | 3.0% |
| Tacoma, WA | $348,500 | 5.4% | 16.4% |
| Tampa, FL | $217,500 | 1.8% | 8.8% |
| Tucson, AZ | $206,800 | -0.1% | 6.1% |
| Tulsa, OK | $160,000 | 0.0% | 5.3% |
| Warren, MI | $195,000 | 5.4% | 12.7% |
| Washington, DC | $390,000 | 5.4% | 8.3% |
| West Palm Beach, FL | $272,000 | 2.6% | 11.0% |
| Worcester, MA | $245,000 | -0.6% | 7.5% |
| National | $297,200 | 4.4% | 8.9% |
Homes Sold
| Redfin Metro | Homes Sold | Month-Over-Month | Year-Over-Year |
|---|---|---|---|
| Albany, NY | 749 | 36.2% | 10.3% |
| Allentown, PA | 640 | 32.8% | 6.1% |
| Atlanta, GA | 9,396 | 33.5% | -3.7% |
| Austin, TX | 2,820 | 31.4% | 4.4% |
| Bakersfield, CA | 728 | 31.4% | -8.4% |
| Baltimore, MD | 3,444 | 33.6% | 3.8% |
| Baton Rouge, LA | 910 | 32.7% | -11.2% |
| Birmingham, AL | 1,392 | 31.2% | 0.1% |
| Boston, MA | 3,055 | 44.8% | -10.8% |
| Buffalo, NY | 659 | -9.0% | -13.1% |
| Camden, NJ | 1,635 | 23.8% | -2.9% |
| Charlotte, NC | 3,323 | 37.0% | -12.5% |
| Chicago, IL | 8,541 | 36.2% | -1.3% |
| Cincinnati, OH | 1,976 | 38.4% | -2.6% |
| Cleveland, OH | 2,213 | 55.7% | -1.6% |
| Columbus, OH | 2,313 | 35.7% | -9.5% |
| Dallas, TX | 5,225 | 27.9% | -6.0% |
| Denver, CO | 4,412 | 38.4% | -2.8% |
| Detroit, MI | 1,543 | 6.9% | -18.7% |
| Fort Lauderdale, FL | 3,067 | 24.2% | -7.0% |
| Fort Worth, TX | 2,658 | 23.3% | -9.0% |
| Fresno, CA | 791 | 27.8% | 4.2% |
| Grand Rapids, MI | 1,207 | 55.1% | -2.4% |
| Greenville, SC | 1,068 | 31.5% | -3.6% |
| Hampton Roads, VA | 2,003 | 35.8% | 2.9% |
| Honolulu, HI | 787 | 32.3% | -0.6% |
| Houston, TX | 7,053 | 27.1% | -3.4% |
| Indianapolis, IN | 2,679 | 35.6% | -10.1% |
| Jacksonville, FL | 2,230 | 32.4% | -1.1% |
| Kansas City, MO | 2,770 | 40.0% | -5.5% |
| Knoxville, TN | 1,152 | 21.5% | -6.1% |
| Las Vegas, NV | 3,861 | 44.8% | -2.3% |
| Long Island, NY | 1,961 | 15.9% | -12.8% |
| Los Angeles, CA | 6,296 | 45.7% | -5.1% |
| Louisville, KY | 1,353 | 46.6% | -4.3% |
| Memphis, TN | 1,056 | 27.2% | -3.4% |
| Miami, FL | 2,544 | 30.7% | -4.8% |
| Milwaukee, WI | 1,582 | 61.3% | 15.1% |
| Minneapolis, MN | 3,985 | 48.0% | -7.0% |
| Montgomery County, PA | 1,839 | 37.3% | -2.9% |
| Nashville, TN | 3,121 | 37.2% | -1.8% |
| New Orleans, LA | 1,092 | 21.3% | -11.9% |
| Oakland, CA | 2,245 | 55.4% | -2.9% |
| Oklahoma City, OK | 1,791 | 36.1% | 5.5% |
| Omaha, NE | 976 | 39.0% | -9.5% |
| Orange County, CA | 2,600 | 41.9% | -9.0% |
| Orlando, FL | 4,013 | 35.6% | 3.1% |
| Oxnard, CA | 715 | 47.4% | -9.4% |
| Philadelphia, PA | 1,907 | 19.0% | -6.6% |
| Phoenix, AZ | 9,321 | 34.5% | 1.3% |
| Pittsburgh, PA | 1,893 | 55.0% | 5.2% |
| Portland, OR | 2,900 | 23.6% | -7.9% |
| Providence, RI | 1,416 | 34.2% | -1.2% |
| Raleigh, NC | 2,118 | 47.4% | -11.1% |
| Richmond, VA | 1,562 | 46.1% | -0.8% |
| Riverside, CA | 4,980 | 35.0% | -8.7% |
| Rochester, NY | 700 | 12.9% | -14.6% |
| Sacramento, CA | 2,467 | 32.3% | -3.5% |
| Salt Lake City, UT | 1,608 | 32.2% | -0.8% |
| San Antonio, TX | 2,458 | 34.8% | -0.1% |
| San Diego, CA | 2,870 | 24.8% | -11.6% |
| San Francisco, CA | 960 | 54.3% | 0.8% |
| San Jose, CA | 1,296 | 56.9% | 1.2% |
| Seattle, WA | 3,683 | 29.6% | -7.8% |
| St. Louis, MO | 3,204 | 41.3% | -6.7% |
| Tacoma, WA | 1,350 | 26.1% | -5.5% |
| Tampa, FL | 5,513 | 32.5% | -3.5% |
| Tucson, AZ | 1,568 | 32.9% | -1.3% |
| Tulsa, OK | 1,075 | 30.8% | 1.5% |
| Warren, MI | 2,965 | 25.2% | -3.3% |
| Washington, DC | 7,267 | 35.1% | -5.5% |
| West Palm Beach, FL | 3,123 | 37.6% | -1.5% |
| Worcester, MA | 632 | 31.9% | -3.7% |
| National | 230,300 | 34.5% | -3.7% |
New Listings
| Redfin Metro | New Listings | Month-Over-Month | Year-Over-Year |
|---|---|---|---|
| Albany, NY | 958 | 30.9% | -6.0% |
| Albuquerque, NM | 1,587 | 31.4% | 4.6% |
| Allentown, PA | 1,025 | 19.7% | -7.0% |
| Atlanta, GA | 12,484 | 28.1% | 3.1% |
| Austin, TX | 4,229 | 35.2% | -1.1% |
| Bakersfield, CA | 1,055 | 13.0% | 0.6% |
| Baltimore, MD | 5,288 | 41.2% | -7.9% |
| Baton Rouge, LA | 1,272 | 10.5% | -7.0% |
| Birmingham, AL | 1,729 | 18.8% | -11.7% |
| Boston, MA | 5,143 | 27.8% | -16.7% |
| Buffalo, NY | 1,105 | 39.3% | -5.7% |
| Camden, NJ | 2,386 | 15.1% | -9.8% |
| Charlotte, NC | 4,915 | 33.3% | -3.1% |
| Chicago, IL | 15,264 | 36.3% | -3.8% |
| Cincinnati, OH | 2,725 | 32.4% | -4.4% |
| Cleveland, OH | 3,119 | 34.0% | -9.5% |
| Columbus, OH | 3,102 | 45.2% | -0.9% |
| Dallas, TX | 7,603 | 33.6% | -2.8% |
| Denver, CO | 5,750 | 35.7% | -7.5% |
| Detroit, MI | 2,198 | 39.3% | -1.4% |
| Fort Lauderdale, FL | 4,500 | 4.5% | -0.8% |
| Fort Worth, TX | 3,773 | 36.0% | 0.4% |
| Fresno, CA | 988 | 12.8% | -9.9% |
| Grand Rapids, MI | 1,538 | 42.5% | -6.7% |
| Greenville, SC | 1,507 | 37.0% | 5.5% |
| Hampton Roads, VA | 2,976 | 38.4% | -4.8% |
| Honolulu, HI | 1,026 | 7.2% | -11.9% |
| Houston, TX | 11,141 | 32.7% | -1.7% |
| Indianapolis, IN | 3,240 | 40.4% | -11.5% |
| Jacksonville, FL | 3,054 | 18.5% | -1.9% |
| Kansas City, MO | 4,138 | 53.6% | 7.5% |
| Knoxville, TN | 1,585 | 40.1% | 11.5% |
| Las Vegas, NV | 4,370 | 17.8% | -7.0% |
| Long Island, NY | 3,464 | 15.4% | -11.7% |
| Los Angeles, CA | 7,959 | 8.3% | -11.4% |
| Louisville, KY | 1,667 | 37.5% | -9.7% |
| Memphis, TN | 1,439 | 24.5% | -9.2% |
| Miami, FL | 4,441 | 1.3% | -8.8% |
| Milwaukee, WI | 2,086 | 46.4% | -10.7% |
| Minneapolis, MN | 6,167 | 34.4% | -19.1% |
| Montgomery County, PA | 2,839 | 16.7% | -20.6% |
| Nashville, TN | 4,520 | 28.8% | 4.9% |
| New Orleans, LA | 1,892 | 40.1% | 3.0% |
| Oakland, CA | 2,873 | 20.1% | -5.3% |
| Oklahoma City, OK | 2,355 | 37.0% | -6.5% |
| Omaha, NE | 1,459 | 55.4% | -9.7% |
| Orange County, CA | 3,373 | 8.8% | -14.8% |
| Orlando, FL | 4,898 | 14.9% | -2.8% |
| Oxnard, CA | 1,009 | 26.0% | -3.7% |
| Philadelphia, PA | 2,962 | 14.9% | -11.6% |
| Phoenix, AZ | 10,404 | 16.5% | -5.8% |
| Pittsburgh, PA | 2,590 | 38.5% | -7.3% |
| Portland, OR | 3,849 | 47.4% | 2.3% |
| Providence, RI | 1,953 | 19.7% | -11.4% |
| Raleigh, NC | 2,901 | 24.3% | -9.3% |
| Richmond, VA | 2,135 | 30.1% | -10.0% |
| Riverside, CA | 6,380 | 8.2% | -6.5% |
| Rochester, NY | 1,240 | 43.5% | -4.1% |
| Sacramento, CA | 3,376 | 20.3% | -5.0% |
| Salt Lake City, UT | 2,058 | 34.8% | -5.9% |
| San Antonio, TX | 3,622 | 38.5% | 3.3% |
| San Diego, CA | 4,031 | 19.2% | -7.3% |
| San Francisco, CA | 1,238 | 22.1% | -5.4% |
| San Jose, CA | 1,583 | 22.3% | -9.2% |
| Seattle, WA | 5,152 | 50.2% | 1.9% |
| St. Louis, MO | 4,664 | 27.3% | -12.1% |
| Tacoma, WA | 1,686 | 44.7% | -3.4% |
| Tampa, FL | 6,907 | 17.3% | -2.3% |
| Tucson, AZ | 1,877 | 17.5% | -1.7% |
| Tulsa, OK | 1,377 | 22.3% | -12.1% |
| Warren, MI | 4,152 | 48.6% | -6.0% |
| Washington, DC | 11,550 | 42.1% | -10.1% |
| West Palm Beach, FL | 4,183 | 1.9% | -2.6% |
| Worcester, MA | 1,019 | 32.2% | -16.7% |
| National | 326,100 | 26.3% | -5.6% |
All Homes for Sale
| Redfin Metro | All Homes for Sale | Month-Over-Month | Year-Over-Year |
|---|---|---|---|
| Albany, NY | 2,109 | -4.4% | -29.2% |
| Albuquerque, NM | 2,978 | -27.9% | -21.3% |
| Allentown, PA | 2,933 | 22.3% | 11.4% |
| Atlanta, GA | 22,353 | 2.3% | -28.7% |
| Austin, TX | 6,448 | 7.9% | -4.1% |
| Bakersfield, CA | 1,865 | -0.5% | -6.4% |
| Baltimore, MD | 10,235 | 7.7% | -0.2% |
| Baton Rouge, LA | 3,608 | 0.5% | 26.6% |
| Birmingham, AL | 4,692 | 0.7% | -18.2% |
| Boston, MA | 5,188 | 0.2% | -25.3% |
| Buffalo, NY | 1,427 | -4.4% | -42.4% |
| Camden, NJ | 7,297 | 2.6% | -3.8% |
| Charlotte, NC | 9,735 | 6.3% | -23.8% |
| Chicago, IL | 34,036 | 9.0% | -14.0% |
| Cincinnati, OH | 6,698 | 8.3% | -10.9% |
| Cleveland, OH | 7,173 | 0.1% | -17.9% |
| Columbus, OH | 5,112 | 8.8% | -16.3% |
| Dallas, TX | 11,664 | 0.3% | -4.8% |
| Denver, CO | 4,729 | 10.6% | -11.8% |
| Detroit, MI | 3,478 | -5.8% | -10.2% |
| Fort Lauderdale, FL | 14,376 | 3.5% | 0.3% |
| Fort Worth, TX | 4,921 | -5.6% | -16.9% |
| Fresno, CA | 1,356 | -2.5% | -14.3% |
| Grand Rapids, MI | 1,699 | -3.1% | -15.9% |
| Greenville, SC | 3,749 | 5.5% | -6.1% |
| Hampton Roads, VA | 6,666 | 0.6% | -15.8% |
| Honolulu, HI | 3,075 | 1.9% | 5.7% |
| Houston, TX | 22,853 | 3.3% | -7.5% |
| Indianapolis, IN | 4,777 | -5.5% | -31.9% |
| Jacksonville, FL | 6,260 | 1.7% | -9.6% |
| Knoxville, TN | 4,255 | 4.8% | -11.3% |
| Las Vegas, NV | 8,802 | 0.1% | -22.9% |
| Long Island, NY | 9,069 | 1.8% | -15.5% |
| Los Angeles, CA | 13,567 | -3.0% | -15.7% |
| Louisville, KY | 2,490 | 1.9% | -14.3% |
| Memphis, TN | 2,624 | -1.8% | -23.0% |
| Miami, FL | 17,901 | -2.1% | -3.0% |
| Milwaukee, WI | 4,438 | 6.3% | -26.0% |
| Minneapolis, MN | 8,105 | 7.6% | -23.7% |
| Montgomery County, PA | 6,592 | 4.7% | -11.2% |
| Nashville, TN | 9,145 | 5.8% | 2.0% |
| New Orleans, LA | 5,843 | 2.6% | 5.2% |
| Oakland, CA | 2,004 | -0.1% | -19.0% |
| Oklahoma City, OK | 5,003 | -1.9% | -18.1% |
| Omaha, NE | 1,440 | -1.1% | -20.1% |
| Orange County, CA | 6,034 | -0.8% | -18.3% |
| Orlando, FL | 8,581 | -4.9% | -16.8% |
| Oxnard, CA | 1,342 | 3.5% | -4.6% |
| Philadelphia, PA | 6,670 | 0.1% | -11.3% |
| Phoenix, AZ | 19,249 | -3.2% | -17.3% |
| Pittsburgh, PA | 8,477 | 2.4% | -16.5% |
| Portland, OR | 4,185 | 3.4% | -0.3% |
| Providence, RI | 4,084 | -1.3% | -19.4% |
| Raleigh, NC | 5,915 | 5.3% | -10.8% |
| Richmond, VA | 2,748 | 1.4% | -21.0% |
| Riverside, CA | 13,969 | -3.3% | -13.5% |
| Rochester, NY | 1,520 | 0.7% | -42.6% |
| Sacramento, CA | 3,727 | 1.0% | -5.9% |
| Salt Lake City, UT | 2,689 | -11.5% | -2.5% |
| San Antonio, TX | 7,037 | -4.7% | -8.8% |
| San Diego, CA | 5,252 | 5.2% | -2.8% |
| San Francisco, CA | 1,058 | 3.9% | -23.8% |
| San Jose, CA | 907 | -9.6% | -41.5% |
| Seattle, WA | 2,833 | 18.2% | -14.7% |
| St. Louis, MO | 10,551 | 1.2% | -11.1% |
| Tacoma, WA | 1,355 | 4.5% | -24.8% |
| Tampa, FL | 12,058 | -3.3% | -12.6% |
| Tucson, AZ | 4,515 | -2.9% | -9.5% |
| Tulsa, OK | 3,429 | -1.2% | -14.2% |
| Warren, MI | 5,317 | -0.4% | -20.7% |
| Washington, DC | 18,996 | 12.8% | 11.8% |
| West Palm Beach, FL | 14,966 | -1.4% | -2.9% |
| Worcester, MA | 1,410 | -0.3% | -28.3% |
| National | 636,800 | 2.2% | -11.9% |
Median Off-Market Redfin Estimate
| Redfin Metro | Estimate | Month-Over-Month | Year-Over-Year |
|---|---|---|---|
| Albany, NY | $207,200 | 0.4% | 5.3% |
| Allentown, PA | $196,700 | -0.3% | 3.9% |
| Atlanta, GA | $199,500 | 0.5% | 10.3% |
| Austin, TX | $289,700 | 0.5% | 1.4% |
| Bakersfield, CA | $202,200 | 0.5% | 5.6% |
| Baltimore, MD | $245,000 | 0.2% | 2.4% |
| Baton Rouge, LA | $147,700 | 0.4% | -3.0% |
| Birmingham, AL | $141,400 | 0.2% | 5.7% |
| Boston, MA | $468,400 | 0.9% | 4.9% |
| Buffalo, NY | $147,300 | -0.1% | 7.0% |
| Camden, NJ | $186,000 | 0.2% | 3.3% |
| Charlotte, NC | $190,500 | 1.8% | 16.0% |
| Chicago, IL | $229,100 | 0.0% | 3.0% |
| Cincinnati, OH | $158,900 | 1.7% | 7.7% |
| Cleveland, OH | $130,100 | 0.5% | 2.0% |
| Columbus, OH | $177,800 | 1.3% | 10.4% |
| Dallas, TX | $244,800 | 0.7% | 10.1% |
| Denver, CO | $391,700 | 1.5% | 9.5% |
| Detroit, MI | $90,900 | 4.3% | 15.3% |
| Fort Lauderdale, FL | $249,600 | 0.3% | 8.2% |
| Fort Worth, TX | $199,100 | 0.8% | 12.5% |
| Fresno, CA | $239,300 | 0.6% | 8.8% |
| Grand Rapids, MI | $149,100 | 0.4% | 7.7% |
| Greenville, SC | $158,100 | 0.9% | 8.2% |
| Hampton Roads, VA | $216,900 | 0.4% | 3.6% |
| Honolulu, HI | $670,600 | 0.1% | 4.5% |
| Houston, TX | $197,700 | 0.4% | 5.7% |
| Indianapolis, IN | $148,500 | 0.6% | 8.5% |
| Jacksonville, FL | $202,300 | 0.6% | 14.0% |
| Kansas City, MO | $175,000 | 0.5% | 8.5% |
| Knoxville, TN | $140,700 | 0.7% | 5.1% |
| Las Vegas, NV | $249,000 | 1.2% | 15.5% |
| Long Island, NY | $423,800 | 0.2% | 6.5% |
| Los Angeles, CA | $595,500 | 0.7% | 8.0% |
| Louisville, KY | $144,100 | -0.1% | -2.4% |
| Memphis, TN | $129,800 | 1.2% | 11.9% |
| Miami, FL | $282,600 | 0.5% | 7.0% |
| Milwaukee, WI | $196,000 | 3.0% | 8.8% |
| Minneapolis, MN | $243,500 | 0.6% | 7.8% |
| Montgomery County, PA | $307,500 | 0.3% | 4.1% |
| Nashville, TN | $232,800 | 0.6% | 12.4% |
| New Orleans, LA | $161,900 | -2.6% | -5.3% |
| Oakland, CA | $733,600 | 1.1% | 10.1% |
| Oklahoma City, OK | $135,700 | 0.4% | 1.2% |
| Omaha, NE | $160,500 | 0.7% | 6.1% |
| Orange County, CA | $691,500 | 0.6% | 5.4% |
| Orlando, FL | $218,400 | 0.6% | 9.2% |
| Oxnard, CA | $581,900 | 0.2% | 5.7% |
| Philadelphia, PA | $192,000 | 0.2% | 9.9% |
| Phoenix, AZ | $252,100 | 0.7% | 6.7% |
| Pittsburgh, PA | $135,000 | -0.2% | 2.6% |
| Portland, OR | $379,200 | 0.2% | 4.5% |
| Providence, RI | $281,100 | 0.2% | 6.4% |
| Raleigh, NC | $249,800 | 0.4% | 6.7% |
| Richmond, VA | $212,200 | 0.5% | 7.0% |
| Riverside, CA | $347,800 | 0.7% | 8.9% |
| Rochester, NY | $135,900 | 0.2% | 4.4% |
| Sacramento, CA | $384,800 | 0.7% | 7.8% |
| Salt Lake City, UT | $302,000 | 0.9% | 9.8% |
| San Antonio, TX | $182,500 | 0.2% | 7.0% |
| San Diego, CA | $570,600 | 0.8% | 8.0% |
| San Francisco, CA | $1,280,900 | 1.4% | 12.8% |
| San Jose, CA | $1,187,100 | 3.5% | 23.9% |
| Seattle, WA | $536,400 | 1.4% | 14.6% |
| St. Louis, MO | $147,700 | 0.2% | 0.9% |
| Tacoma, WA | $323,800 | 0.9% | 12.7% |
| Tampa, FL | $206,300 | 0.5% | 9.4% |
| Tucson, AZ | $194,900 | 0.5% | 6.6% |
| Tulsa, OK | $133,500 | 0.3% | 2.1% |
| Warren, MI | $198,500 | 0.4% | 5.5% |
| Washington, DC | $375,600 | 0.3% | 2.8% |
| West Palm Beach, FL | $256,900 | 0.2% | 3.6% |
| Worcester, MA | $270,900 | 0.9% | 7.5% |
| National | $281,300 | -0.8% | 6.1% |
The post March Home Prices Up 8.9%, the Biggest Increase in Four Years appeared first on Redfin Real-Time.