Mortgage Rates Driven to Historic Lows by the Coronavirus Amp Up Homebuyer Purchasing Power
Homebuyers in Dallas and Portland, Oregon saw an increase in the share of homes affordable, while those in Phoenix and Las Vegas saw a decrease.
A dramatic drop in mortgage interest rates, driven by coronavirus fears, has given homebuyers a big boost in purchasing power in recent weeks. At the current mortgage interest rate of 3.2%, a homebuyer with a $2,500 monthly mortgage budget could afford to purchase a home priced $51,250 higher than in March of 2019 when rates were 4.4%. Put another way, as a result of the drop in mortgage interest rates, the monthly payment on a $457,000 home has dropped from $2,500 a year ago to $2,250 today; and a homeowner who could afford a $457,000 home in March of 2019 could afford one at $508,250 today. Although most of the broad economic consequences of the coronavirus, or COVID-19, have been negative, these historically low rates may at least offer some positive news.
“Potential homebuyers now have an extra incentive to buy a home despite all of the economic uncertainty from the coronavirus,” said Redfin chief economist Daryl Fairweather. “Many current homeowners now have the option to refinance their mortgages and gain some extra spending cash each month. Low interest rates won’t help with direct impacts of the coronavirus on the economy like declines in tourism and service sector spending, but they will mitigate impacts to housing.”
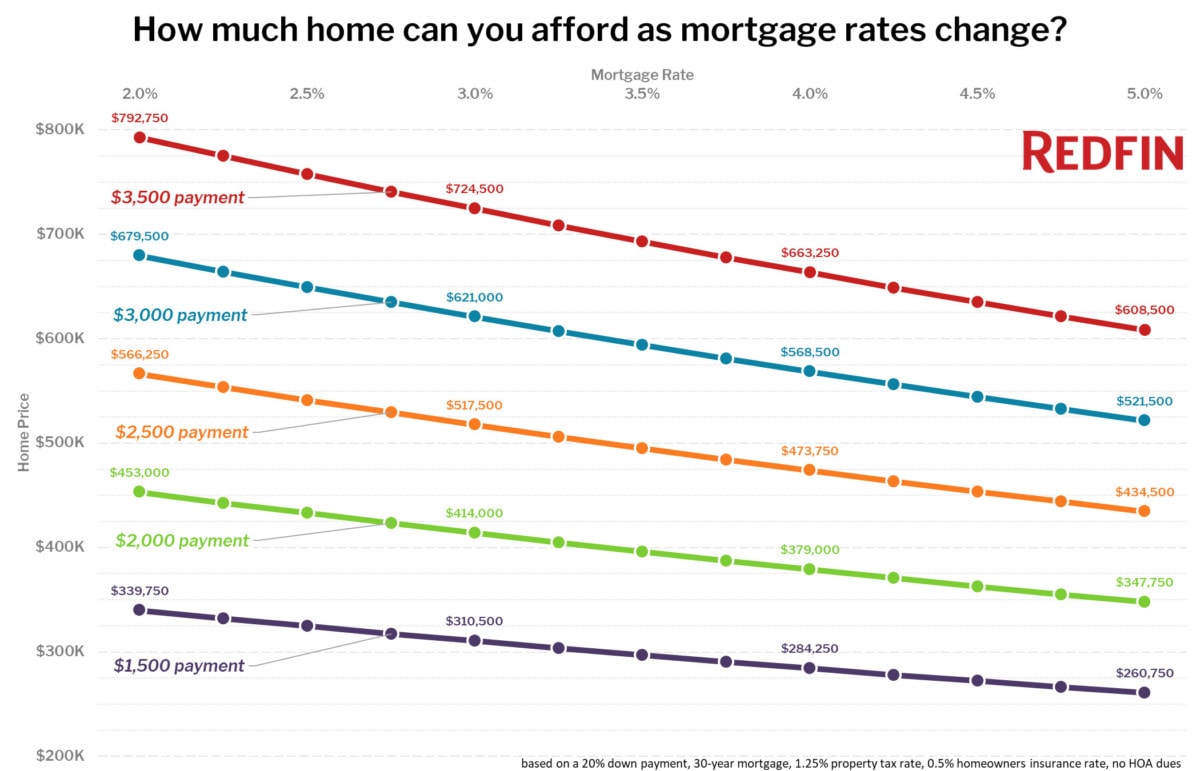
The interactive mortgage rates chart below shows how much you could afford to spend on a home at different mortgage interest rates, with each line representing a different monthly payment. You can view or download a static version of this chart here.
The boost in purchasing power comes at a welcome time for homebuyers who have been facing major inventory crunches and intense bidding wars in many markets. Despite there being fewer homes for sale in most markets this year, the share of homes for sale that were affordable on a $2,500 monthly payment increased 1.9 percentage points nationally, from 68.6% between March 4 and March 10, 2019 to 70.5% between March 2 and 8, 2020.
The markets where homebuyers are experiencing the biggest boost in affordable inventory compared to a year ago were Dallas (+6.2 points), Portland, OR (+5.2 points), and Richmond, VA (+4.3 points).
“I just had a buyer who was at the top of his budget lock in a 2.99% mortgage rate and he is ecstatic at how much more flexibility his finances will have thanks to the interest rate drop,” said Portland Redfin agent Meme Loggins. “Another one of my buyers was looking at condos just a few weeks ago because he didn’t think he could afford a single family home, but thanks to the low rates he can now. Homebuyers in every price range are excited, even those looking at homes priced well over $1 million. Unfortunately we are still facing competition on every offer, which leads us to drop contingencies and offer above list price. With the inventory crunch, these low rates are definitely adding to the frenzy.”
Even with the drop in mortgage rates, some markets still saw a decline in the share of homes affordable. The share of affordable inventory on a $2,500 payment fell 3.6 points in Phoenix, 3.4 points in Las Vegas and 1 point in Orlando.
Share of Homes for Sale Affordable on a $2,500 Monthly Payment
| Metro Area | Total Homes for Sale, March 4-10, 2019 | Total Homes for Sale, March 2-8, 2020 | Share of Homes Affordable on a $2,500 Payment, 2019 | Share of Homes Affordable on a $2,500 Payment, 2020 | Change in Share of Homes Affordable, 2019 to 2020 |
|---|---|---|---|---|---|
| Dallas, TX | 18,195 | 15,597 | 69.6% | 75.8% | 6.2 pts |
| Portland, OR | 6,335 | 4,835 | 49.9% | 55.1% | 5.2 pts |
| Richmond, VA | 3,244 | 2,515 | 76.6% | 80.9% | 4.3 pts |
| Milwaukee, WI | 4,397 | 4,276 | 80.6% | 84.8% | 4.2 pts |
| San Diego, CA | 7,576 | 4,889 | 19.7% | 23.7% | 4.0 pts |
| Nashville, TN | 11,083 | 9,983 | 72.4% | 76.1% | 3.7 pts |
| Minneapolis, MN | 8,838 | 8,214 | 69.6% | 73.2% | 3.6 pts |
| New York, NY | 35,344 | 33,128 | 26.2% | 29.7% | 3.5 pts |
| Columbus, OH | 5,563 | 5,206 | 82.0% | 85.4% | 3.4 pts |
| Seattle, WA | 6,125 | 3,841 | 23.1% | 26.2% | 3.1 pts |
| Raleigh, NC | 6,742 | 5,921 | 74.9% | 78.1% | 3.1 pts |
| Louisville, KY | 3,057 | 2,756 | 84.0% | 86.8% | 2.9 pts |
| Chicago, IL | 27,981 | 24,325 | 71.6% | 74.4% | 2.8 pts |
| Denver, CO | 7,206 | 5,498 | 44.8% | 47.7% | 2.8 pts |
| Charlotte, NC | 11,513 | 10,019 | 77.2% | 80.0% | 2.8 pts |
| Miami, FL | 20,443 | 16,650 | 55.7% | 58.4% | 2.7 pts |
| Birmingham, AL | 4,751 | 3,991 | 84.3% | 87.0% | 2.7 pts |
| Houston, TX | 28,013 | 26,255 | 77.5% | 80.0% | 2.5 pts |
| Jacksonville, FL | 8,891 | 7,259 | 79.2% | 81.7% | 2.5 pts |
| Austin, TX | 7,426 | 5,684 | 69.1% | 71.4% | 2.3 pts |
| Hartford, CT | 4,882 | 4,558 | 86.6% | 88.8% | 2.2 pts |
| Providence, RI | 5,296 | 4,433 | 73.7% | 75.9% | 2.2 pts |
| Riverside, CA | 18,185 | 13,082 | 62.7% | 64.8% | 2.2 pts |
| Atlanta, GA | 26,234 | 22,649 | 76.5% | 78.6% | 2.1 pts |
| San Jose, CA | 2,325 | 1,595 | 2.3% | 4.3% | 2.0 pts |
| Kansas City, MO | 6,870 | 4,918 | 80.7% | 82.7% | 2.0 pts |
| Baltimore, MD | 10,200 | 8,640 | 75.4% | 77.2% | 1.8 pts |
| Sacramento, CA | 5,060 | 4,008 | 49.8% | 51.5% | 1.7 pts |
| New Orleans, LA | 4,264 | 4,036 | 79.9% | 81.5% | 1.6 pts |
| San Antonio, TX | 9,638 | 8,671 | 84.7% | 86.2% | 1.6 pts |
| Boston, MA | 7,884 | 7,504 | 34.0% | 35.5% | 1.5 pts |
| Virginia Beach, VA | 6,871 | 5,201 | 85.3% | 86.7% | 1.4 pts |
| Detroit, MI | 5,016 | 4,707 | 92.1% | 93.3% | 1.2 pts |
| Oklahoma City, OK | 4,948 | 4,286 | 86.0% | 87.2% | 1.2 pts |
| St. Louis, MO | 8,799 | 7,167 | 87.7% | 88.8% | 1.0 pts |
| Indianapolis, IN | 5,361 | 4,125 | 83.2% | 84.1% | 0.9 pts |
| Buffalo, NY | 1,986 | 1,585 | 90.2% | 91.0% | 0.9 pts |
| Cincinnati, OH | 7,873 | 6,506 | 85.8% | 86.1% | 0.4 pts |
| Memphis, TN | 2,950 | 2,447 | 86.2% | 86.4% | 0.2 pts |
| Pittsburgh, PA | 8,374 | 7,802 | 88.0% | 87.8% | -0.2 pts |
| San Francisco, CA | 1,686 | 1,667 | 1.8% | 1.6% | -0.3 pts |
| Tampa, FL | 16,616 | 11,845 | 80.5% | 80.2% | -0.3 pts |
| Cleveland, OH | 7,960 | 5,883 | 89.7% | 89.2% | -0.4 pts |
| Philadelphia, PA | 7,033 | 6,231 | 81.4% | 80.8% | -0.6 pts |
| Los Angeles, CA | 19,772 | 13,949 | 19.9% | 19.3% | -0.6 pts |
| Salt Lake City, UT | 3,621 | 1,511 | 63.4% | 62.6% | -0.8 pts |
| Washington, D.C. | 13,321 | 11,059 | 55.5% | 54.5% | -0.9 pts |
| Orlando, FL | 11,562 | 8,634 | 79.7% | 78.7% | -1.0 pts |
| Las Vegas, NV | 12,057 | 8,143 | 80.8% | 77.4% | -3.4 pts |
| Phoenix, AZ | 24,664 | 15,339 | 71.5% | 67.8% | -3.6 pts |
| National | 883,656 | 738,139 | 68.6% | 70.5% | 1.9 pts |
Methodology
The home prices listed in the interactive chart and examples above are calculated based on the maximum loan a buyer could pay with the given monthly payments, assuming a 20% down payment plus property taxes (1.25% rate) and insurance (annual premium 0.5% of home value). HOA dues were not included in the calculations. For the March 2020 period, a mortgage rate of 3.20% was used. For the March 2019 period, a mortgage rate of 4.41% was used.
The post Mortgage Rates Driven to Historic Lows by the Coronavirus Amp Up Homebuyer Purchasing Power appeared first on Redfin | Real Estate Tips for Home Buying, Selling & More.
