Prices of Homes for Sale Typically Increased in 81 Percent of Metro Areas in July 2018
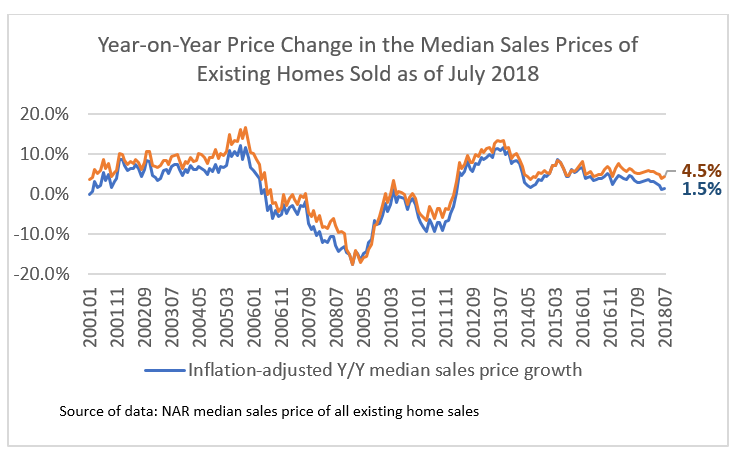
Amid tight supply, home prices are still increasing although at a slower pace. Nationally, the median price of existing homes sold in July 2018 rose to $269,600, up 4.5% from one year ago, but slower than the 5.7% appreciation in 2017.
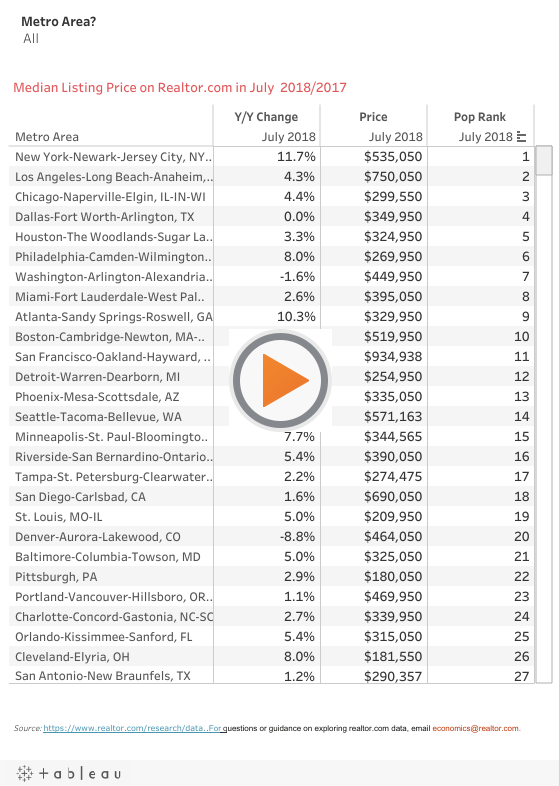
As another indicator, the median list prices of homes listed on Realtor.com increased in 405 out of 500 metro areas on a year-on-year basis, fewer than the 423 metro areas in July 2017. The number of metro areas with higher year-on-year median list price has been trending down since March 2018 (except in June).
The table below shows the change in median list price on Realtor.com in July 2018 compared to one year ago. Among the largest metro areas, the median list prices declined in July 2018 from one year ago in Washington-Arlington-Alexandria, DC-VA-MD-WV (-1.6%), Denver-Aurora-Lakewood, CO (-8.8%), Austin, Round Rock, TX (-3.3%), Greenville-Andersen-Mauldin, SC
(-1.1%), Urban Honolulu, HI (-0.6%), and Cape Coral-Fort Myers FL (-3.2%). Several metro areas in California also had year-on-year declines: Salinas, Sta. Maria-Sta. Barbara, Madera, Truckee-Grass Valley, and Eureka-Arcata-Fortuna.
However, the median list price continues to increase on a year-on-year basis in the high-cost metro areas of California such as Los Angeles-Long Beach-Anaheim (4.3%), San Francisco-Oakland-Hayward (5.7%), San Jose-Sunnyvale, CA (16.5%). The median list price also rose in New York-Newark-Jersey City (11.5%), Atlanta-Sandy Springs, GA (10.3%), and Seattle-Tacoma-Bellevue, WA (14.4%).
Scroll down the data visualization table below or type in a specific metro area name in the box.
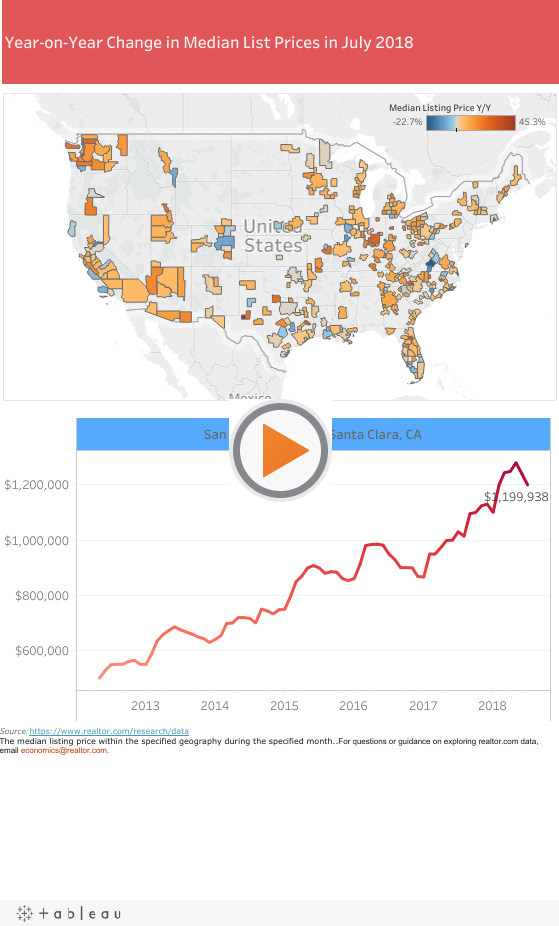
The map below shows where median list prices on Realtor.com declined in July 2018 compared to one year ago (blue areas on the map). Scroll down the table or hover over the map to view the historical median list price trend.
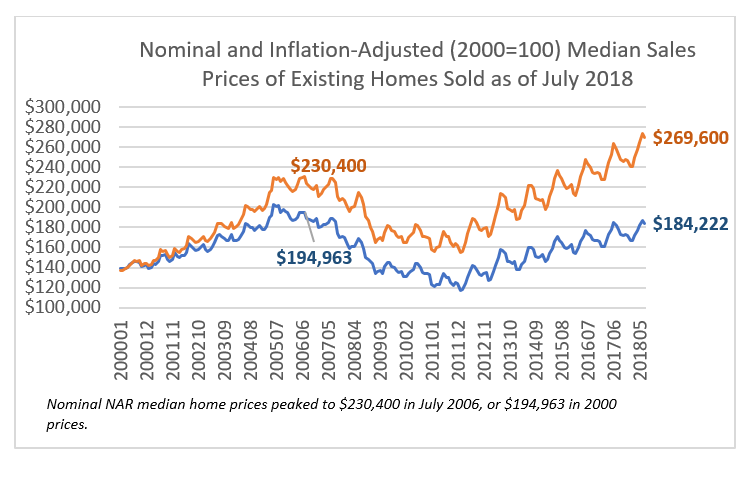
Tight inventory continues to push up prices of existing homes for sale, although at a moderate pace compared to past years. Nationally, the median price of existing homes sold in July 2018 rose to $269,600, up 4.5% from one year ago (vs. 5.7% appreciation in 2017). Adjusted for inflation, home prices rose 1.5 percent. As of July 2018, the nominal median home price ($269,600) is 17% higher than the bubble-era peak price ($230,400), but the inflation-adjusted price ($184,222) is still 6% below the corresponding inflation-adjusted price of the nominal peak level ($194,963).