REALTORS® Expect Home Prices to Increase by Four Percent in the Next 12 Months
In a monthly survey of REALTORS®, respondents are asked “In the neighborhood(s) or area(s) where you make the most sales, what are your expectations for residential property prices over the next year?”
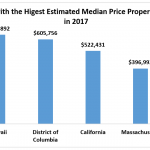
Among the respondents, the median expected price change is four percent. The chart below shows median expected price change by state based on survey responses collected during January–March 2018[1], according to the March 2018 REALTORS® Confidence Index Survey.
Respondents from the states of Washington, Oregon, Idaho, Nevada, Utah, Wyoming, Colorado, Rhode Island, and the District of Columbia expect the highest price growth in the next 12 months, with the expected median price growth at more than five to nearly eight percent. Respondents from California, Arizona, Wisconsin, Michigan, Tennessee, South Carolina, Florida, and New Hampshire also expect strong price growth, with the median expected price growth in the range of more than four to five percent.

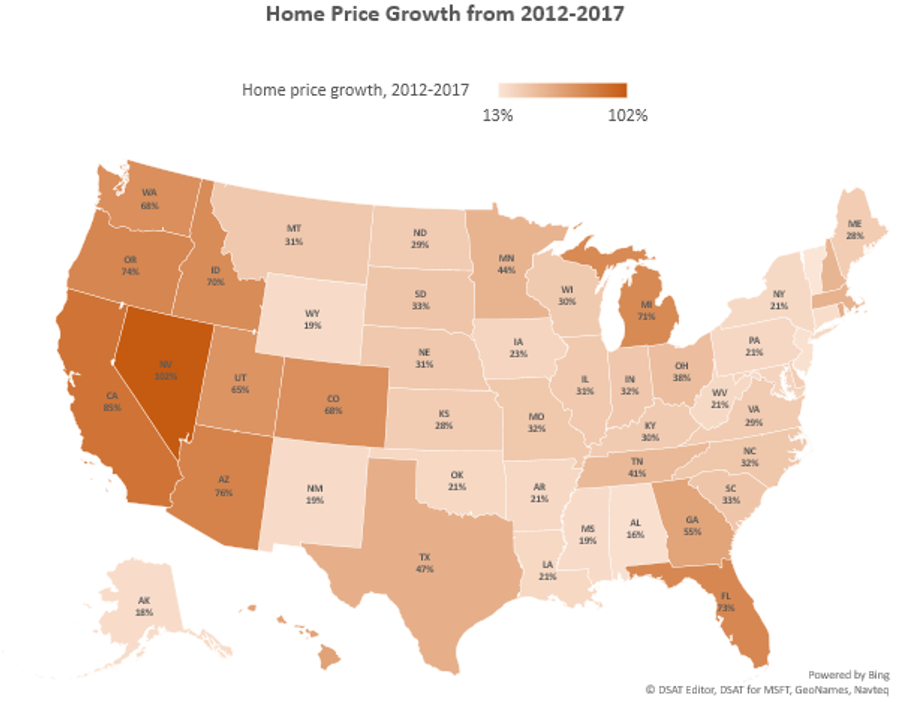
House prices have increased steeply since 2012 compared to the growth in income. Nationally, U.S. home prices rose 44 percent during the period 2012 Q1 –2017 Q4, based on the FHFA Home Price Index expanded, not seasonally adjusted data set.[2] Meanwhile, personal per capita income only increased by 17 percent during this period. Strong demand because of employment growth, historically low interest rates (though slowly creeping up), and inadequate home building (though steadily rising) have all contributed to the steep price increase since 2012.
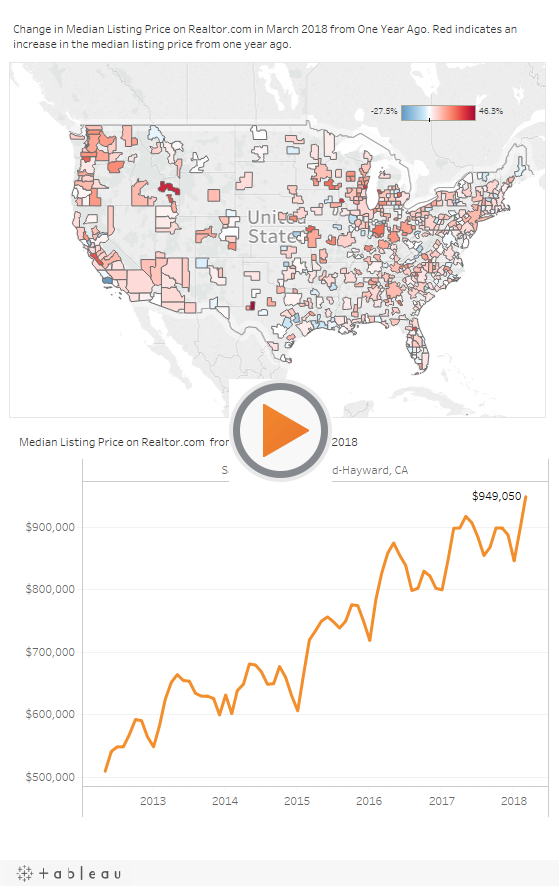
According to Realtor.com data, listing prices were higher in March 2018 compared to one year ago in many metro areas, even in areas where prices are at or near the $1 million level, such as San Jose-Sunnyvale-Sta. Clara (+31%) and San Francisco-Oakland-Hayward (+6%). However, the median listing price decreased in Sta. Maria-Sta. Barbara (-28%) and Napa (-15%).
In high tax areas that were the most affected by the $10,000 total limit on deductions for property, state, and local income taxes, prices are still rising, such as in New York, Newark-Jersey City (+13%), Bridgeport-Stamford-Norwalk (+10%), New Haven-Milford (+5%), and Hartford (+4%).
Use the data visualization below to view the change in median listing prices in March 2018 from one year ago. Red areas are areas where prices rose compared to one year ago. Hover on the map to view the historical median listing prices of properties listed on Realtor.com from June 2012 through March 2018.[3]
[1] Because each month’s survey asks about the outlook in the next months, the responses collected from January-March 2018 covers the outlook for January 2018-March 2019.
[2] The FHFA HPI is a repeat price index. The expanded data set includes county recorder data set. See https://www.fhfa.gov/DataTools/Downloads/pages/house-price-index.aspx
[3] Realtor.com data is freely available and can be download from https://www.realtor.com/research