REALTORS® Reported Strong Buyer Demand and Tight Supply in December 2017
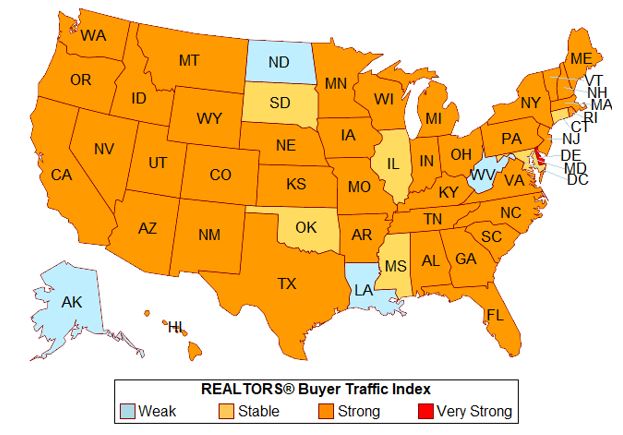
In a monthly survey of REALTORS®, respondents are asked “Compared to the same month last year, how would you rate the past month’s traffic in neighborhood(s) or area(s) where you make most of your sales?” Respondents rate buyer traffic as “Stronger” (100), “Stable” (50), or “Weaker” (0) and the responses are compiled into a diffusion index. An index greater than 50 means that more respondents reported “stronger” than “weaker” conditions.
The chart below shows buyer traffic conditions in October–December 2017 compared to conditions one year ago, according to the December 2017 REALTORS® Confidence Index Survey. Except for four states, REALTORS® reported that buyer conditions were “stable” (unchanged) to “very strong” compared to conditions one year ago.[1] Respondents from Texas and Florida, states which were hit by hurricanes Harvey and Irma, generally reported “strong” buying activity compared to one year ago. On the other hand, Alaska, North Dakota, Louisiana, and West Virginia respondents generally reported “weak” buyer traffic compared to one year ago, and this may be related to the effect of the slump in oil prices since 2015, though oil prices have started to firm up again in 2017 as OPEC cut its oil production.
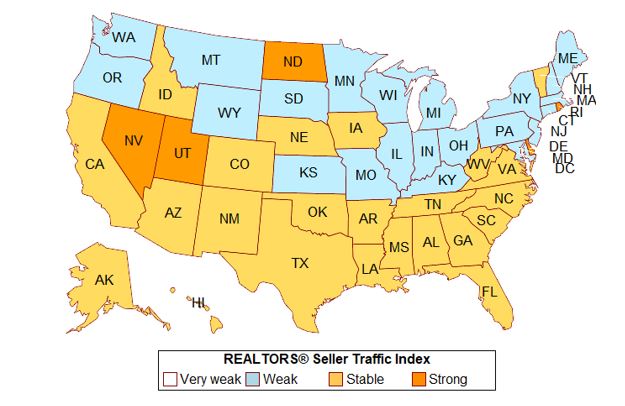
Supply conditions in October –December 2017 is improving but supply is still tight, with only 26 states having seller traffic conditions that are “stable” (unchanged) or “strong” compared to conditions one year ago. Most of the states with stable or improving seller activity in October-December 2017 are in southern area of the United States.
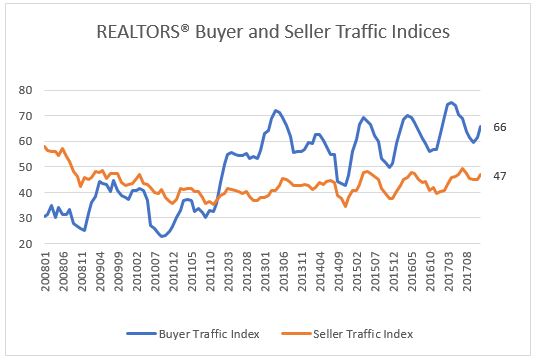
Nationally, the REALTORS® Buyer Traffic Index registered at 66, while the REALTORS® Seller Traffic Index was at 47. An index above 50 indicates that more respondents reported stronger than weaker conditions compared to one year ago, so the data indicates that homebuying demand continues to outpace supply.
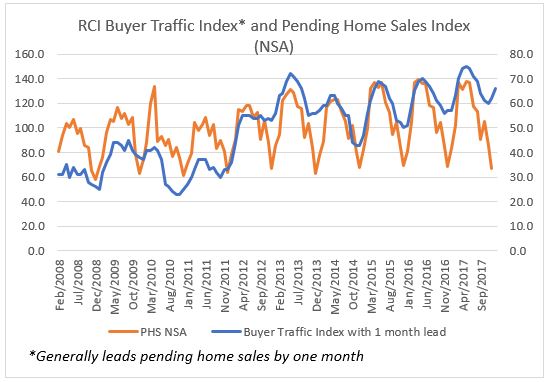
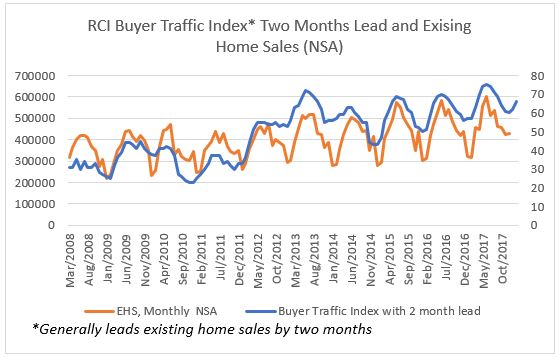
The REALTORS® Buyer Traffic Index as Leading Indicator of Contracts and Sales
The REALTORS® Buyer Traffic Index is a leading indicator of future contracts (pending home sales sales) and closings (existing home sales). The REALTORS® Buyer Traffic Index tends to lead pending home sales by one month and existing home sales by two months. The uptick in the November and December 2017 Buyer Traffic Index indicates a continued uptick in sales on a month-to-month basis in January and February 2018.
[1] In generating the indices, NAR uses data for the last three surveys to have close to 30 observations. Small states such as AK, ND, SD, MT, VT, WY, WV, DE, and D.C., may have fewer than 30 observations. For graphical purposes, index values from 25.01 to 45 are labeled “Weak,” values of 45.01 to 55 are labeled “Stable,” values of 55.01 to 75 are labeled “Strong,” and values greater than 75 are labeled “Very Strong.”