
Redfin Housing Demand Index Remained Nearly Flat in December as Supply Continued to Fall
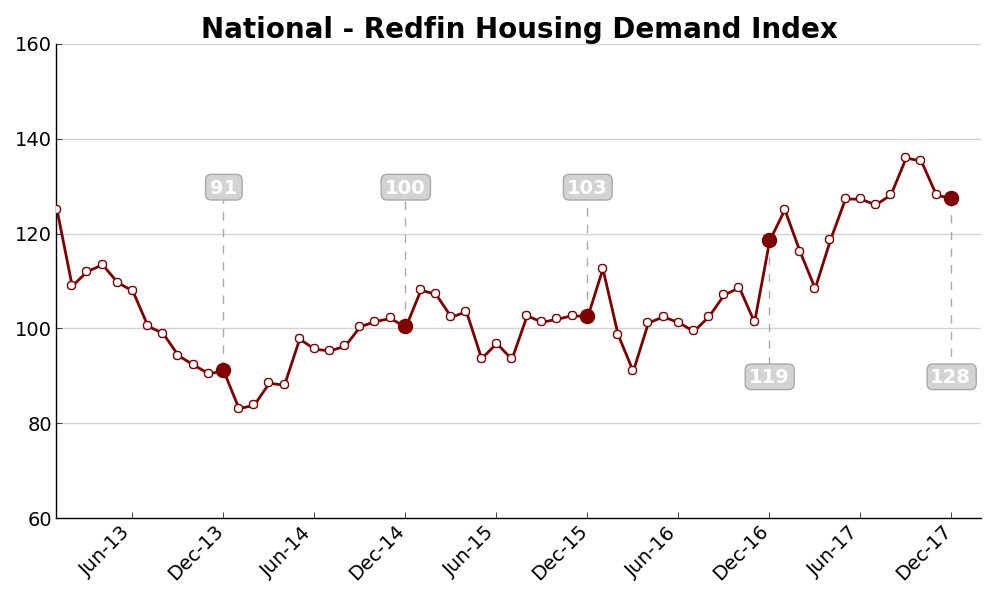
The Redfin Housing Demand Index remained nearly flat into the end of 2017, falling just 0.6 percent from 128.3 in November to 127.6 in December. The seasonally adjusted number of buyers requesting home tours fell by 3.4 percent while the number making offers fell 1.8 percent from November.
“Buyer demand is still strong but wilted a bit in the face of low inventory,” said Redfin chief economist Nela Richardson. “The housing market ended 2017 with 170,000 fewer listings than it had a year earlier, which means there were fewer homes for buyers to tour and make offers on. For the fourth consecutive year, inventory will be the major factor shaping the housing market in 2018.”
The Demand Index is based on thousands of Redfin customers requesting home tours and writing offers. The Demand Index is adjusted for Redfin’s market share growth. A level of 100 represents the historical average for the three-year period from January 2013 to December 2015.
Though the Demand Index remained flat month over month, the year-over-year numbers reveal how homebuyer activity has strengthened to a limited extent due to the supply shortage. Compared with December 2016, the Demand Index was up 8.4 percent and the number of buyers requesting tours was up 16.7 percent. Meanwhile, the number of buyers making offers slid 5.9 percent.
The drop in offer activity can be explained by the fact that inventory fell 20 percent year-over-year in December. Not only was this the largest inventory decline recorded since 2014, when we first began tracking the metric for the 15 markets included in the Demand Index, but December marked the 31st consecutive month of falling supply. What’s more, the number of homes newly listed in December fell 5.6 percent from a year earlier. Taken together, these numbers tell us that there were plenty of people in the market to buy a home last month, but there simply weren’t enough homes for everyone to offer on and purchase.
Metro-Level Demand Highlights
Below, we provide a slideshow of local charts for each of the metros tracked by the Redfin Housing Demand Index and highlight noteworthy trends and agent insights from select markets. If you’d like to learn more about a particular market, please email press@redfin.com.
For more detail on the Redfin Demand Index methodology, click here.
The post Redfin Housing Demand Index Remained Nearly Flat in December as Supply Continued to Fall appeared first on Redfin Real-Time.


