U.S. Home Prices up 5.4% in October
Low mortgage rates prop up homebuyer demand as inventory declines
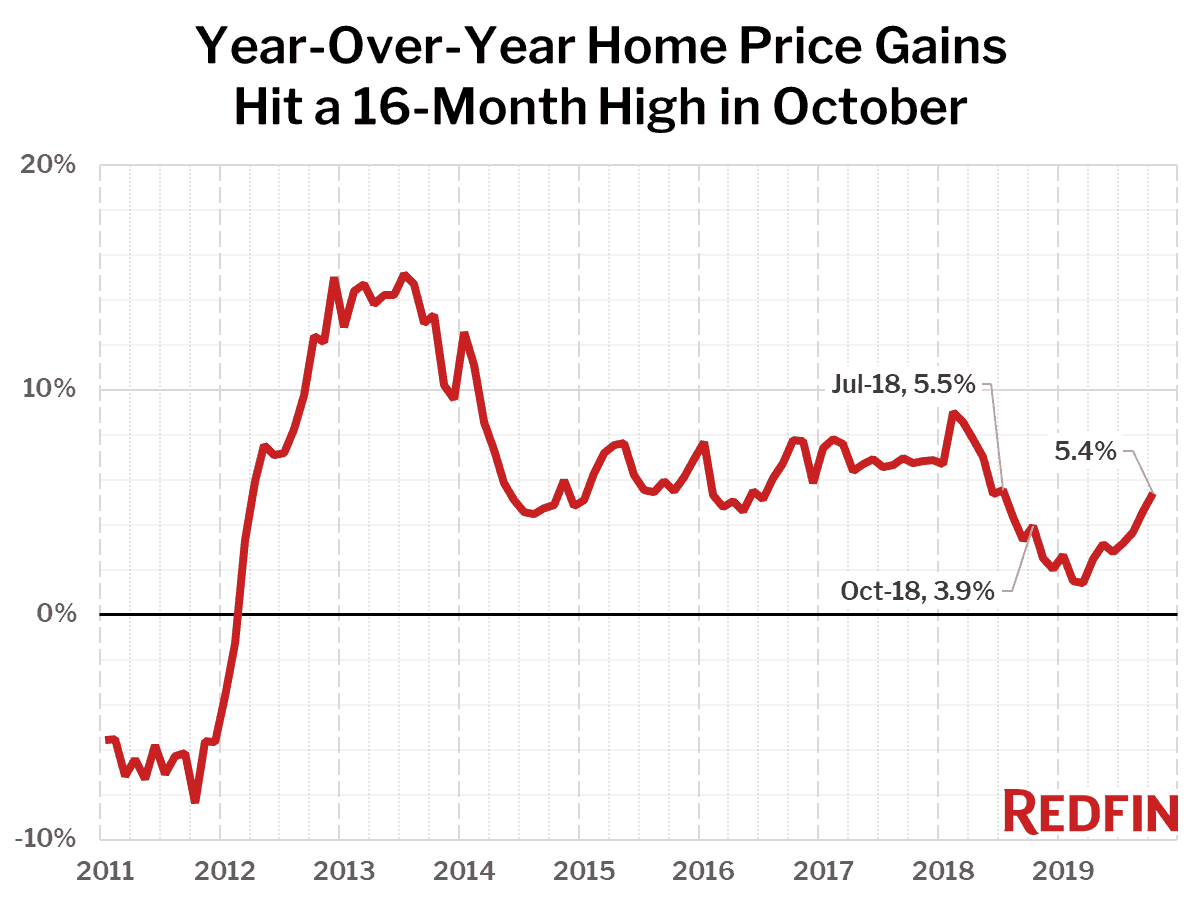
U.S. home-sale prices increased 5.4% year over year in October to a median of $313,200 across the 217 metros Redfin tracks. The increase was the largest since July 2018, although current strength may be overstated given the weakening housing market a year ago. Prices also rose 1.4% between September and October, a time of year when they usually flatten. This is the largest month-over-month increase in an October we’ve seen since at least 2012.
“Low mortgage rates are propping up homebuyer demand and juicing prices, said Redfin chief economist Daryl Fairweather. “However, home sales have been slow to grow since there are so few homes for sale and not many new listings hitting the market, especially affordable ones. The market is split: It’s a seller’s market for moderately priced homes, but a buyer’s market for pricier homes.”
Gains in the nationwide median home price continue to be driven by the affordable metro areas. For the fourth month in a row, the 10 metro areas with the biggest gains all had median sale prices below the national median, led in October by Camden, NJ (median price $197,000, up 13.9%) and Greensboro, NC ($178,500, +10.5%).
In the Washington D.C. metro area, where Amazon announced its HQ2 expansion a year ago, the median home price rose 5.1% from October 2018 to $410,000—a larger year-over-year increase than San Francisco, Seattle, Los Angeles, Boston, New York and most other expensive metro areas across the nation.
Just one of the 85 largest metro areas Redfin tracks saw a year-over-year decline in the median sale price: San Jose, where home prices fell 7.2%. In San Jose, prices were still rising 9.9% a year ago, and home prices didn’t begin to significantly soften until December.
| Market Summary | October 2019 | Month-Over-Month | Year-Over-Year |
|---|---|---|---|
| Median sale price | $313,200 | 1.4% | 5.4% |
| Homes sold, seasonally-adjusted | 266,200 | -0.2% | 1.1% |
| New listings, seasonally-adjusted | 309,800 | -1.0% | -5.2% |
| All Homes for sale | 818,200 | -3.6% | -9.1% |
| Homes for sale, seasonally-adjusted | 786,929 | -1.2% | -8.8% |
| Median days on market | 44 | 2 | 0 |
| Months of supply | 3 | -0.2 | -0.4 |
| Sold above list | 21.3% | -0.7 pts† | -0.1 pts† |
| Median Off-Market Redfin Estimate | $308,500 | -1.4% | 6.4% |
| Average Sale-to-list | 97.9% | 0.1 pts† | 0.2 pts† |
† – “pts” = percentage point change
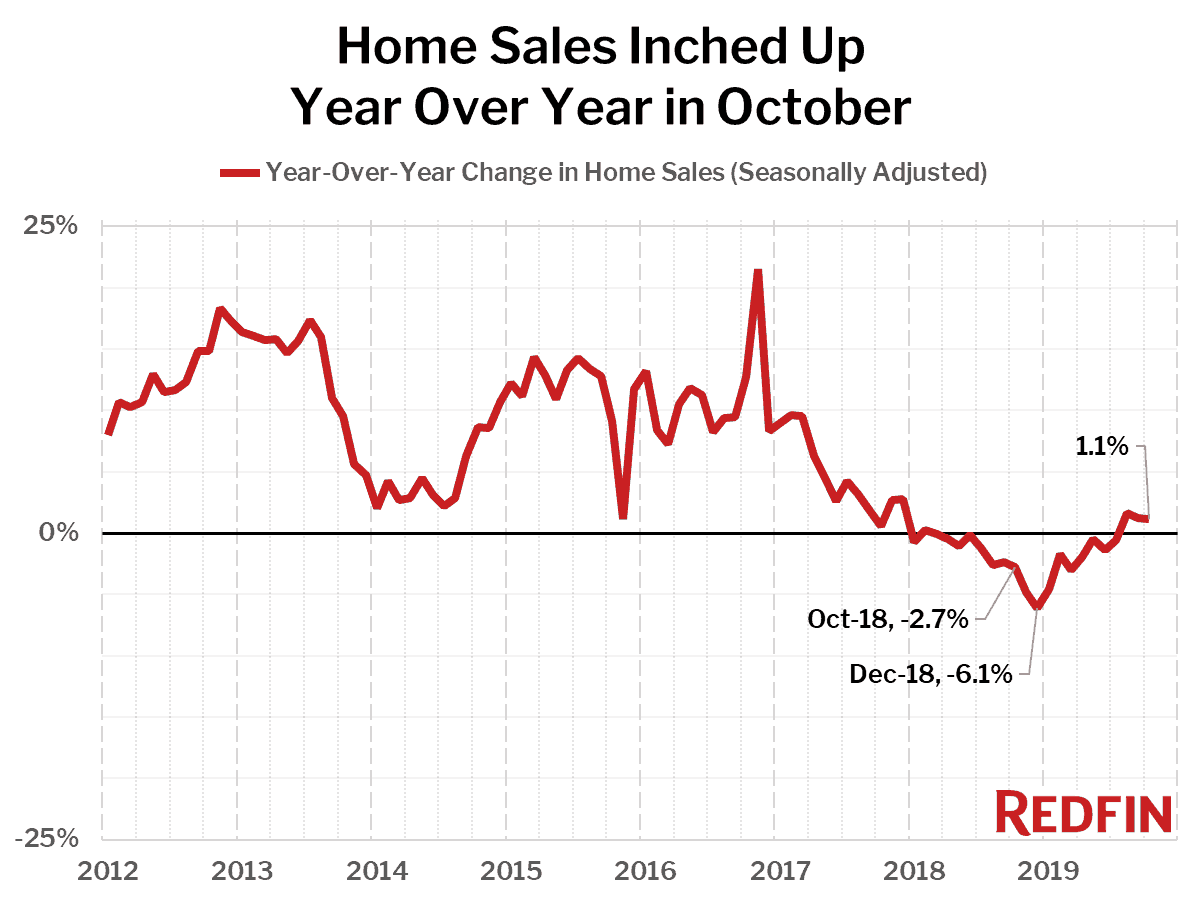
Home sales edged up 1.1% year over year in October, the third consecutive month of increases, and were down slightly from September on a seasonally-adjusted basis.
The seven markets with the biggest increases in home sales were all metro areas in the south with median home prices below the national median, led by Virginia Beach, VA (+19.6%), Greensboro, NC (+17.3%) and Greenville, SC (+16.3%).
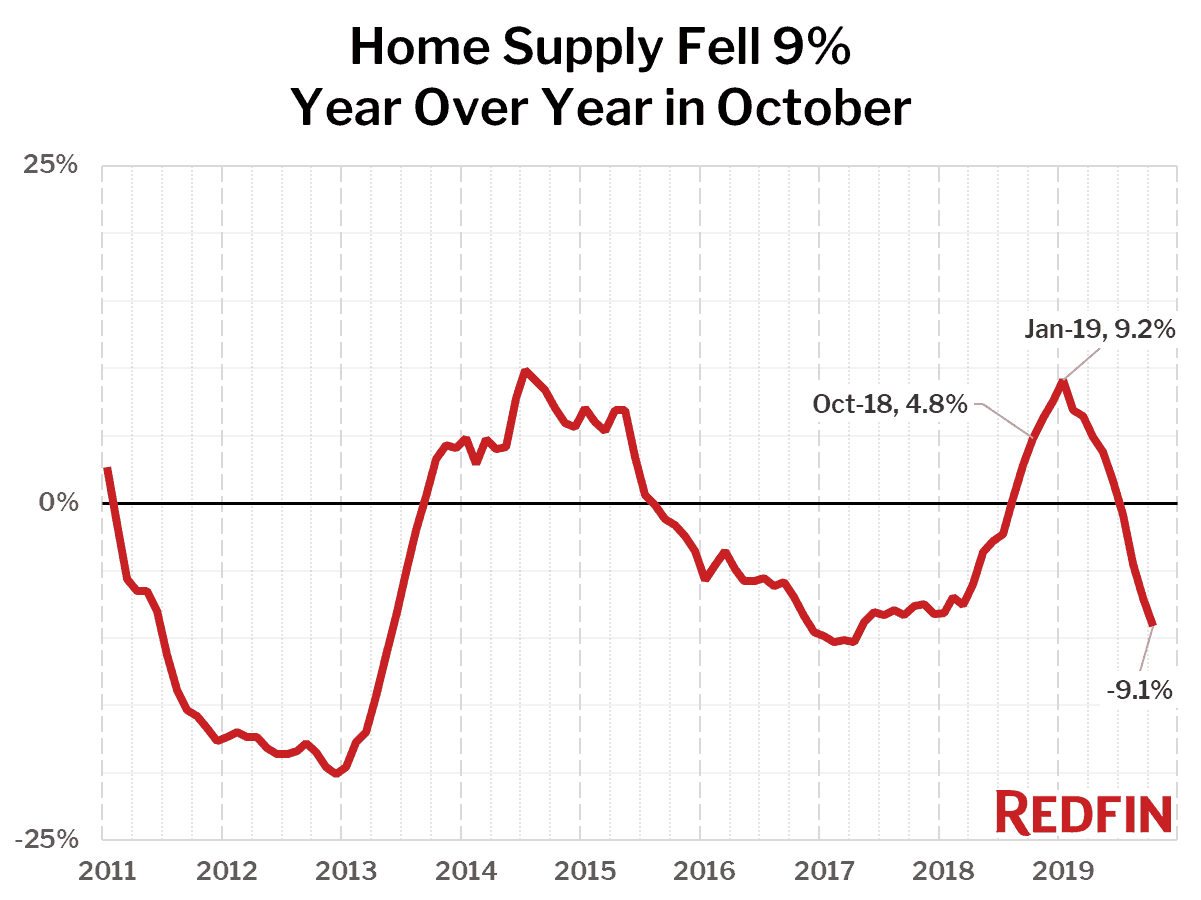
The supply of homes for sale fell 9.1% year over year, the biggest decline since April 2017 and the fourth month in a row of declines. There were fewer homes for sale last month than in any October since 2013. Just 12 of the 85 largest metros tracked by Redfin posted a year-over-year increase in inventory.
Compared to a year ago, the biggest declines in the number of homes for sale were in Salt Lake City, UT (-44.6%), Tacoma, WA (-32.9%) and Tulsa, OK (-31.4%), which are all among the more affordable metro areas in the West.
Home prices usually rise in response to either an increase in demand (home sales) or a decrease in supply (homes for sale). When demand increases and supply decreases, prices usually rise rapidly, as we saw in 2013. October did not see much of an increase in home sales, but it did see a drop in the number of people listing their homes for sale and a drop in overall supply, so it’s likely that the strengthening prices were the result of fewer homes for sale instead.
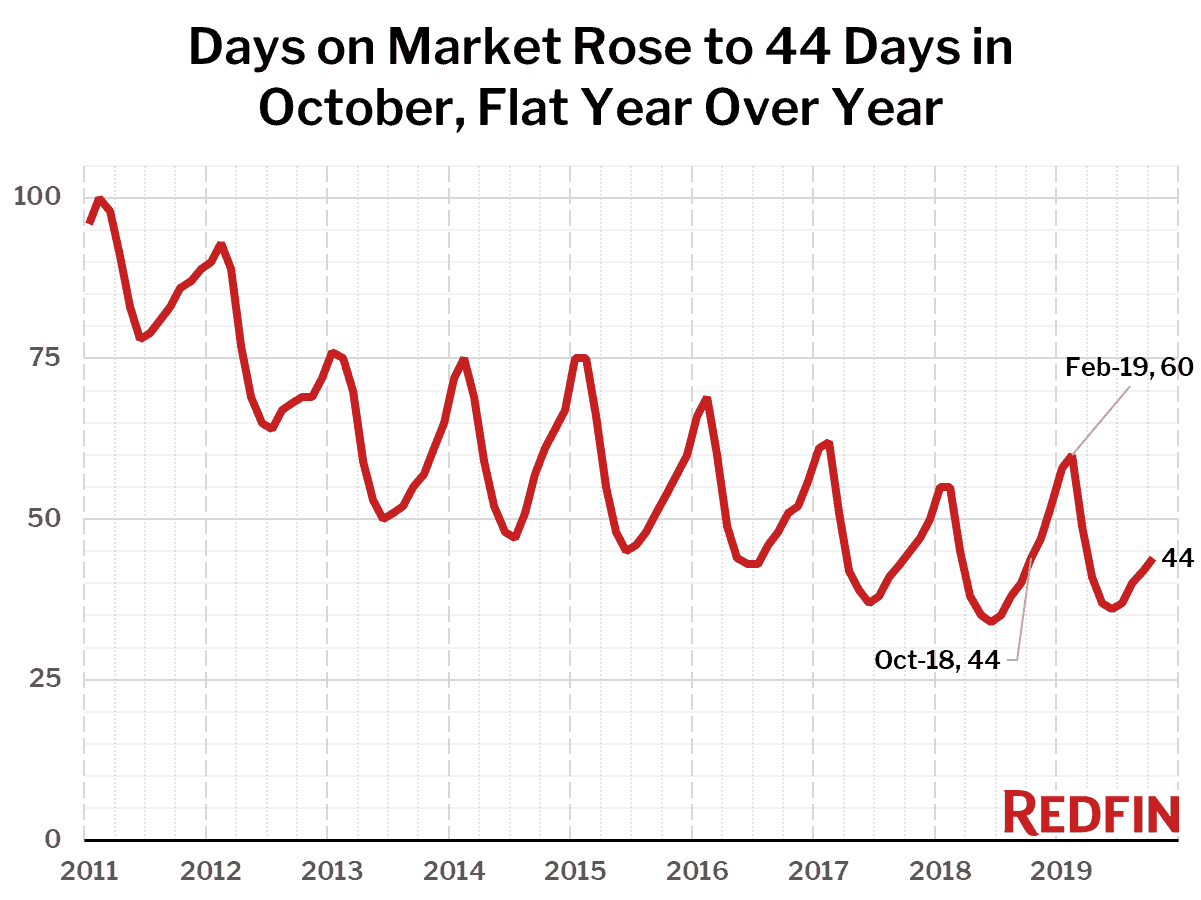
Homes are no longer spending more time on the market before they sell compared to a year earlier. The typical home that sold in October went under contract in 44 days, the same as a year ago.
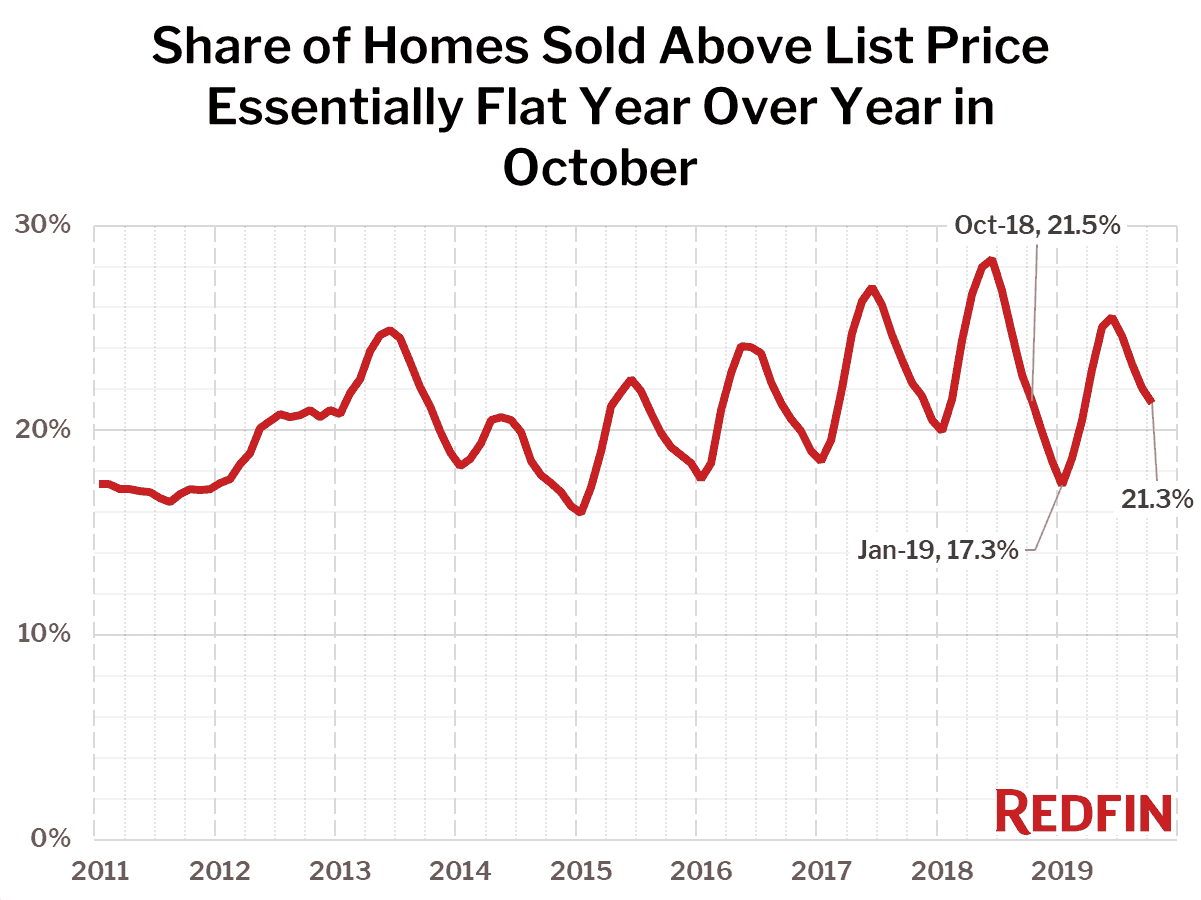
Similarly, the share of homes sold above list price basically flattened out year over year, coming in at 21.3% in October compared to 21.5% a year earlier.
Other October Highlights
Competition
- Omaha, NE was the fastest market, with half of all homes pending sale in just 15 days, down from 17 days a year earlier. Grand Rapids, MI and Indianapolis were the next fastest markets with 16 and 17 median days on market, followed by Tacoma, WA (17) and Oakland, CA (19).
- The most competitive market in October was San Francisco where 64.8% of homes sold above list price, followed by 50.2% in Oakland, CA, 45.4% in Tacoma, WA, 40.9% in Buffalo, NY, and 37.9% in Rochester, NY.
Prices
- Camden, NJ had the nation’s highest price growth, rising 13.9% since last year to $197,000. Greensboro, NC had the second highest growth at 10.5% year-over-year price growth, followed by New Orleans (10.2%) and Tucson, AZ (9.55%).
- 1 metro saw price declines in October: San Jose, CA (-7.2%).
Sales
- Virginia Beach, VA led the nation in year-over-year sales growth, up 19.6%, followed by Greensboro, NC, up 17.3%. Greenville, SC rounded out the top three with sales up 16.3% from a year ago.
- Home sales in Miami and Philadelphia declined by 14.6% and 14.5%, respectively.
Inventory
- Salt Lake City had the largest decrease in overall inventory, falling 44.6% since last October. Tacoma, WA (-32.9%) and Tulsa, OK (-31.4%) also saw far fewer homes available on the market than a year ago.
Predicted Buyer Discounts
- Miami, FL (83.2%) had the largest share of homes for sale predicted to sell for below list price, according to Redfin Estimate data, followed by neighboring markets West Palm Beach, FL (81.2%) and Fort Lauderdale, FL (80.4%).
- San Francisco, CA (89.1%) had the largest share of homes for sale predicted to sell at or above list price, followed by Tacoma, WA (84.0%) and Oakland, CA (83.3%).
Below are market-by-market breakdowns for prices, inventory, new listings and sales for markets with populations of 750 thousand or more. For downloadable data on all of the markets Redfin tracks, visit the Redfin Data Center.
Median Sale Price
| Redfin Metro | Median Sale Price | Month-Over-Month | Year-Over-Year |
|---|---|---|---|
| Albany, NY | $215,000 | -1.4% | 7.5% |
| Allentown, PA | $214,900 | 3.7% | 8.9% |
| Anaheim, CA | $710,000 | -1.3% | 1.4% |
| Atlanta, GA | $244,900 | -1.1% | 5.6% |
| Austin, TX | $325,500 | 1.7% | 6.7% |
| Bakersfield, CA | $249,200 | 0.5% | 7.4% |
| Baltimore, MD | $278,000 | -5.8% | 5.9% |
| Baton Rouge, LA | $210,900 | -0.8% | 6.1% |
| Birmingham, AL | $200,000 | -2.4% | 2.6% |
| Boston, MA | $485,000 | -1.0% | 3.2% |
| Bridgeport, CT | $350,200 | -7.8% | 0.1% |
| Buffalo, NY | $160,500 | -1.8% | 5.6% |
| Camden, NJ | $197,000 | -1.0% | 13.9% |
| Charlotte, NC | $256,000 | -1.5% | 8.0% |
| Chicago, IL | $242,000 | -1.2% | 4.3% |
| Cincinnati, OH | $181,800 | -1.8% | 6.9% |
| Cleveland, OH | $157,800 | 1.4% | 8.8% |
| Columbus, OH | $215,000 | -0.8% | 7.5% |
| Dallas, TX | $295,400 | 0.1% | 5.5% |
| Dayton, OH | $140,000 | -9.1% | 7.7% |
| Denver, CO | $418,400 | 1.6% | 4.9% |
| Detroit, MI | $142,000 | -1.1% | 9.2% |
| El Paso, TX | $166,000 | 0.0% | 5.7% |
| Elgin, IL | $230,000 | 7.7% | 7.8% |
| Fort Lauderdale, FL | $275,000 | 2.8% | 7.8% |
| Fort Worth, TX | $250,000 | 0.8% | 7.1% |
| Frederick, MD | $409,000 | 4.3% | 4.1% |
| Fresno, CA | $282,000 | -1.1% | 5.2% |
| Grand Rapids, MI | $209,100 | -0.4% | 7.2% |
| Greensboro, NC | $178,500 | 3.8% | 10.5% |
| Greenville, SC | $218,000 | 0.5% | 9.0% |
| Hartford, CT | $224,400 | 1.3% | 5.6% |
| Houston, TX | $240,000 | -1.9% | 2.1% |
| Indianapolis, IN | $189,900 | 1.4% | 9.1% |
| Kansas City, MO | $218,500 | -0.5% | 4.0% |
| Knoxville, TN | $212,200 | -2.7% | 5.1% |
| Lake County, IL | $230,000 | 0.0% | 8.5% |
| Las Vegas, NV | $289,300 | -1.0% | 4.1% |
| Los Angeles, CA | $646,000 | 0.5% | 4.5% |
| Louisville, KY | $195,000 | -1.5% | 4.6% |
| McAllen, TX | $165,000 | 6.0% | 6.1% |
| Memphis, TN | $177,000 | -1.9% | 1.1% |
| Miami, FL | $310,000 | 0.0% | 4.6% |
| Milwaukee, WI | $220,600 | -4.1% | 6.1% |
| Minneapolis, MN | $280,000 | 0.0% | 5.3% |
| Montgomery County, PA | $315,000 | -4.5% | 5.0% |
| Nashville, TN | $299,900 | 0.0% | 5.6% |
| Nassau County, NY | $465,000 | -2.1% | 4.5% |
| New Brunswick, NJ | $327,000 | -0.9% | 5.5% |
| New Haven, CT | $215,000 | -1.4% | 4.9% |
| New Orleans, LA | $224,300 | 3.8% | 10.2% |
| New York, NY | $495,000 | -2.9% | 2.1% |
| Newark, NJ | $353,000 | -1.9% | 7.0% |
| North Port, FL | $269,200 | -3.9% | 4.3% |
| Oakland, CA | $746,500 | 2.7% | 3.0% |
| Oklahoma City, OK | $182,000 | -1.6% | 7.1% |
| Omaha, NE | $210,400 | 2.6% | 8.4% |
| Orlando, FL | $255,000 | -1.9% | 6.2% |
| Oxnard, CA | $615,000 | 0.9% | 0.0% |
| Philadelphia, PA | $210,000 | 3.4% | 6.3% |
| Phoenix, AZ | $287,500 | 2.5% | 8.5% |
| Pittsburgh, PA | $170,000 | -1.7% | 6.2% |
| Portland, OR | $405,000 | 1.2% | 4.0% |
| Providence, RI | $290,000 | -1.7% | 7.4% |
| Raleigh, NC | $293,500 | 1.2% | 4.8% |
| Richmond, VA | $257,000 | 0.2% | 4.9% |
| Riverside, CA | $385,000 | 0.0% | 6.3% |
| Rochester, NY | $155,000 | 1.3% | 6.9% |
| Sacramento, CA | $410,000 | -1.2% | 5.1% |
| Salt Lake City, UT | $342,000 | -0.9% | 5.9% |
| San Antonio, TX | $233,500 | 1.5% | 6.1% |
| San Diego, CA | $590,000 | 2.6% | 5.4% |
| San Francisco, CA | $1,425,000 | 4.8% | 1.8% |
| San Jose, CA | $1,070,000 | -0.2% | -7.2% |
| Seattle, WA | $560,000 | 3.7% | 1.8% |
| St. Louis, MO | $187,000 | 1.1% | 7.8% |
| Tacoma, WA | $370,000 | -2.6% | 8.8% |
| Tampa, FL | $234,900 | 0.0% | 4.4% |
| Tucson, AZ | $233,300 | 3.2% | 9.5% |
| Tulsa, OK | $175,000 | 0.6% | 5.2% |
| Urban Honolulu, HI | $593,500 | -2.7% | 2.3% |
| Virginia Beach, VA | $234,900 | -1.7% | 4.4% |
| Warren, MI | $218,000 | -1.4% | 8.1% |
| Washington, DC | $410,000 | 2.5% | 5.1% |
| West Palm Beach, FL | $285,000 | -1.7% | 3.6% |
| Worcester, MA | $279,000 | -0.4% | 9.4% |
| National | $313,200 | 1.4% | 5.4% |
Homes Sold
| Redfin Metro | Homes Sold, seasonally adjusted | Month-Over-Month | Year-Over-Year |
|---|---|---|---|
| Albany, NY | 817 | 1.8% | -2.8% |
| Allentown, PA | 885 | -2.2% | 1.0% |
| Anaheim, CA | 2,531 | -1.7% | 10.1% |
| Atlanta, GA | 8,818 | 0.6% | -3.6% |
| Austin, TX | 3,024 | -0.8% | 7.6% |
| Bakersfield, CA | 752 | -7.2% | 1.3% |
| Baltimore, MD | 3,469 | -1.4% | -1.3% |
| Baton Rouge, LA | 882 | 8.3% | 8.6% |
| Boston, MA | 4,138 | 0.5% | -0.4% |
| Bridgeport, CT | 995 | 0.7% | 3.7% |
| Buffalo, NY | 934 | -9.0% | -9.9% |
| Camden, NJ | 1,570 | -8.4% | -8.0% |
| Charlotte, NC | 3,804 | 1.7% | 12.5% |
| Chicago, IL | 7,798 | 0.6% | -1.9% |
| Cincinnati, OH | 2,677 | 3.3% | 3.6% |
| Cleveland, OH | 2,491 | -0.9% | 4.4% |
| Columbus, OH | 2,542 | -0.3% | 0.7% |
| Dallas, TX | 5,645 | 0.2% | 5.6% |
| Dayton, OH | 1,008 | 1.6% | 5.4% |
| Denver, CO | 4,680 | -0.3% | 9.6% |
| Detroit, MI | 1,729 | -2.8% | -2.7% |
| El Paso, TX | 722 | 5.2% | 11.6% |
| Elgin, IL | 913 | -1.0% | -2.8% |
| Fort Lauderdale, FL | 2,748 | -7.6% | -12.5% |
| Fort Worth, TX | 2,914 | 1.4% | 4.3% |
| Frederick, MD | 1,466 | 0.3% | 5.5% |
| Fresno, CA | 771 | 1.2% | 3.3% |
| Grand Rapids, MI | 1,283 | 1.8% | 3.0% |
| Greensboro, NC | 867 | 5.4% | 17.2% |
| Greenville, SC | 1,149 | 2.5% | 12.8% |
| Hartford, CT | 1,301 | -0.6% | 4.0% |
| Houston, TX | 7,554 | 1.1% | 6.1% |
| Indianapolis, IN | 2,923 | 1.7% | 2.3% |
| Kansas City, MO | 2,974 | 0.8% | -0.7% |
| Knoxville, TN | 1,177 | -3.0% | -3.2% |
| Lake County, IL | 1,051 | 0.2% | 0.8% |
| Las Vegas, NV | 3,462 | -0.5% | 6.1% |
| Los Angeles, CA | 5,830 | -0.6% | 4.5% |
| Louisville, KY | 1,311 | -0.1% | -0.3% |
| McAllen, TX | 280 | -0.3% | 9.8% |
| Memphis, TN | 1,063 | -6.2% | -9.8% |
| Miami, FL | 2,224 | -11.2% | -14.1% |
| Milwaukee, WI | 1,782 | 1.7% | 4.6% |
| Minneapolis, MN | 5,092 | 0.8% | 1.7% |
| Montgomery County, PA | 2,206 | -0.1% | -0.1% |
| Nashville, TN | 3,575 | 3.9% | 14.3% |
| Nassau County, NY | 2,512 | 3.1% | -4.2% |
| New Brunswick, NJ | 3,045 | 3.0% | 1.2% |
| New Haven, CT | 840 | -4.4% | -4.2% |
| New Orleans, LA | 1,253 | 1.2% | 4.4% |
| New York, NY | 4,335 | -2.8% | -7.2% |
| Newark, NJ | 2,085 | -1.1% | -0.8% |
| North Port, FL | 1,972 | 1.3% | 10.1% |
| Oakland, CA | 2,188 | -0.2% | -1.4% |
| Oklahoma City, OK | 1,915 | 1.5% | 8.9% |
| Omaha, NE | 1,126 | -1.4% | 1.0% |
| Orlando, FL | 3,839 | -4.7% | 1.1% |
| Oxnard, CA | 744 | 2.2% | 8.3% |
| Philadelphia, PA | 1,902 | -10.4% | -14.5% |
| Phoenix, AZ | 8,302 | -1.9% | 10.1% |
| Pittsburgh, PA | 2,009 | -6.5% | -3.0% |
| Portland, OR | 3,146 | 0.8% | 0.8% |
| Providence, RI | 1,745 | 0.3% | -3.4% |
| Raleigh, NC | 2,369 | 3.2% | 11.2% |
| Richmond, VA | 1,603 | -0.9% | 6.3% |
| Riverside, CA | 4,668 | -1.7% | 2.0% |
| Rochester, NY | 1,000 | -6.2% | -4.4% |
| Sacramento, CA | 2,572 | 0.3% | -0.3% |
| Salt Lake City, UT | 1,519 | -2.2% | -5.1% |
| San Antonio, TX | 2,790 | 0.6% | 3.7% |
| San Diego, CA | 2,945 | -4.0% | 8.1% |
| San Francisco, CA | 868 | -0.7% | -7.3% |
| San Jose, CA | 1,170 | 5.6% | 2.6% |
| Seattle, WA | 3,807 | 1.5% | 7.2% |
| St. Louis, MO | 3,358 | -2.3% | -5.3% |
| Tacoma, WA | 1,307 | -0.5% | -1.4% |
| Tampa, FL | 5,386 | -1.2% | 1.8% |
| Tucson, AZ | 1,477 | -1.8% | 1.6% |
| Tulsa, OK | 1,205 | -0.2% | 8.8% |
| Urban Honolulu, HI | 782 | 1.0% | 7.3% |
| Virginia Beach, VA | 2,288 | 7.1% | 18.7% |
| Warren, MI | 3,291 | -0.7% | -4.1% |
| Washington, DC | 6,018 | -2.2% | -0.5% |
| West Palm Beach, FL | 2,577 | -3.9% | -10.5% |
| Worcester, MA | 1,085 | 6.6% | 10.0% |
| National | 266,200 | -0.2% | 1.1% |
New Listings
| Redfin Metro | New Listings, seasonally adjusted | Month-Over-Month | Year-Over-Year |
|---|---|---|---|
| Albany, NY | 1,056 | -8.0% | -5.0% |
| Albuquerque, NM | 730 | -1.4% | -44.8% |
| Allentown, PA | 773 | -5.4% | -31.8% |
| Anaheim, CA | 2,754 | -0.2% | -10.0% |
| Atlanta, GA | 10,303 | -1.6% | -5.9% |
| Austin, TX | 3,572 | -0.8% | 5.6% |
| Bakersfield, CA | 899 | 1.5% | -0.8% |
| Baltimore, MD | 4,279 | 0.0% | -0.2% |
| Baton Rouge, LA | 811 | -11.6% | -26.6% |
| Boston, MA | 5,071 | -1.1% | -5.2% |
| Bridgeport, CT | 1,379 | -3.8% | -2.6% |
| Buffalo, NY | 1,197 | -4.6% | -1.0% |
| Camden, NJ | 1,975 | -3.3% | -11.8% |
| Charlotte, NC | 4,114 | -0.7% | -0.2% |
| Chicago, IL | 10,246 | -0.2% | -3.5% |
| Cincinnati, OH | 2,930 | -4.5% | -2.9% |
| Cleveland, OH | 2,925 | -0.3% | 0.6% |
| Columbus, OH | 2,907 | -0.5% | 3.3% |
| Dallas, TX | 7,144 | -0.8% | 3.3% |
| Dayton, OH | 1,148 | 0.3% | -4.5% |
| Denver, CO | 4,995 | -1.2% | -3.4% |
| Detroit, MI | 2,274 | -5.6% | -7.2% |
| El Paso, TX | 894 | -3.4% | 18.1% |
| Elgin, IL | 1,179 | 2.3% | -0.8% |
| Fort Lauderdale, FL | 3,494 | -2.3% | -17.4% |
| Fort Worth, TX | 3,567 | 1.7% | 9.8% |
| Frederick, MD | 1,718 | -2.3% | 0.0% |
| Fresno, CA | 822 | -6.3% | -13.3% |
| Grand Rapids, MI | 1,605 | 2.5% | 12.6% |
| Greensboro, NC | 797 | -3.0% | -7.3% |
| Greenville, SC | 1,233 | -1.5% | -0.8% |
| Hartford, CT | 1,614 | -4.3% | 2.8% |
| Houston, TX | 9,797 | 0.8% | 1.8% |
| Indianapolis, IN | 3,090 | 2.6% | -1.1% |
| Kansas City, MO | 2,375 | -21.4% | -30.3% |
| Knoxville, TN | 1,342 | -0.3% | 10.9% |
| Lake County, IL | 1,378 | 4.6% | 1.0% |
| Las Vegas, NV | 3,852 | -0.9% | -11.8% |
| Los Angeles, CA | 6,641 | -2.3% | -12.1% |
| Louisville, KY | 1,524 | -2.0% | -0.5% |
| McAllen, TX | 419 | -9.7% | -11.3% |
| Memphis, TN | 1,257 | -2.5% | -3.0% |
| Miami, FL | 3,868 | 0.2% | -12.8% |
| Milwaukee, WI | 1,873 | -0.4% | -0.6% |
| Minneapolis, MN | 5,564 | 0.7% | 1.4% |
| Montgomery County, PA | 2,591 | -0.4% | -4.5% |
| Nashville, TN | 4,190 | 2.0% | 6.0% |
| Nassau County, NY | 3,331 | -3.7% | -6.3% |
| New Brunswick, NJ | 3,763 | -5.2% | -8.8% |
| New Haven, CT | 1,082 | -3.1% | 1.2% |
| New Orleans, LA | 1,428 | -8.9% | 15.3% |
| New York, NY | 7,830 | -6.0% | -8.8% |
| Newark, NJ | 2,667 | -6.8% | -5.6% |
| North Port, FL | 2,240 | -3.4% | -3.1% |
| Oakland, CA | 2,411 | -3.5% | -11.7% |
| Oklahoma City, OK | 2,183 | 2.1% | 5.1% |
| Omaha, NE | 1,191 | 0.2% | -1.0% |
| Orlando, FL | 4,630 | 3.8% | 1.0% |
| Oxnard, CA | 777 | -1.0% | -11.0% |
| Philadelphia, PA | 2,827 | -2.7% | -3.1% |
| Phoenix, AZ | 8,608 | -0.4% | -1.9% |
| Pittsburgh, PA | 2,428 | -5.2% | -0.7% |
| Portland, OR | 3,486 | 1.4% | -1.3% |
| Providence, RI | 2,148 | -1.7% | -4.9% |
| Raleigh, NC | 2,528 | -0.2% | 4.8% |
| Richmond, VA | 1,884 | 1.8% | 12.9% |
| Riverside, CA | 5,375 | -0.5% | -9.6% |
| Rochester, NY | 1,175 | -2.3% | 1.1% |
| Sacramento, CA | 2,879 | -2.4% | -10.7% |
| Salt Lake City, UT | 1,175 | -10.5% | -39.5% |
| San Antonio, TX | 3,594 | 1.2% | 10.4% |
| San Diego, CA | 3,271 | 1.2% | -7.9% |
| San Francisco, CA | 1,060 | -0.4% | -4.3% |
| San Jose, CA | 1,285 | 2.4% | -15.6% |
| Seattle, WA | 3,911 | -0.6% | -8.9% |
| St. Louis, MO | 2,716 | -22.8% | -33.1% |
| Tacoma, WA | 1,340 | 1.8% | -5.6% |
| Tampa, FL | 6,016 | -0.5% | -5.2% |
| Tulsa, OK | 1,005 | -3.2% | -28.0% |
| Urban Honolulu, HI | 873 | -4.8% | -13.1% |
| Virginia Beach, VA | 2,507 | -1.1% | 0.8% |
| Warren, MI | 4,111 | -0.3% | -1.5% |
| Washington, DC | 6,663 | -3.2% | -5.8% |
| West Palm Beach, FL | 3,572 | 3.7% | -2.3% |
| Worcester, MA | 1,185 | -6.6% | -7.3% |
| National | 309,800 | -1.0% | -5.2% |
All Homes for Sale
| Redfin Metro | All Homes for Sale | Month-Over-Month | Year-Over-Year |
|---|---|---|---|
| Albany, NY | 3,202 | -5.7% | -7.6% |
| Albuquerque, NM | 2,281 | 18.7% | -43.4% |
| Allentown, PA | 2,095 | 4.4% | -28.6% |
| Anaheim, CA | 7,297 | -12.0% | -17.1% |
| Atlanta, GA | 25,626 | -4.8% | -7.8% |
| Austin, TX | 7,006 | -7.9% | -16.3% |
| Bakersfield, CA | 1,833 | -6.0% | -19.4% |
| Baltimore, MD | 10,416 | -7.0% | -5.5% |
| Baton Rouge, LA | 3,663 | 3.4% | -7.1% |
| Birmingham, AL | 4,210 | -1.8% | -12.5% |
| Boston, MA | 10,384 | -8.2% | 1.7% |
| Bridgeport, CT | 5,902 | -5.9% | -1.6% |
| Buffalo, NY | 2,297 | -4.1% | -10.9% |
| Camden, NJ | 5,248 | -9.8% | -23.3% |
| Charlotte, NC | 10,327 | -4.1% | -8.7% |
| Cincinnati, OH | 7,511 | -5.0% | -13.5% |
| Cleveland, OH | 8,057 | -5.8% | -8.0% |
| Columbus, OH | 6,732 | -0.6% | 0.7% |
| Dallas, TX | 17,738 | -7.8% | -2.9% |
| Dayton, OH | 2,579 | 1.2% | -16.2% |
| Denver, CO | 7,968 | -9.8% | -6.3% |
| Detroit, MI | 5,689 | -5.2% | 0.9% |
| El Paso, TX | 2,700 | -1.7% | 3.2% |
| Fort Lauderdale, FL | 13,364 | 2.7% | -4.6% |
| Fort Worth, TX | 7,129 | -8.9% | -4.0% |
| Frederick, MD | 3,652 | -4.9% | -4.9% |
| Fresno, CA | 1,660 | -9.7% | -15.6% |
| Grand Rapids, MI | 2,803 | -4.1% | 4.0% |
| Greensboro, NC | 1,969 | 1.4% | -20.1% |
| Greenville, SC | 4,048 | -3.2% | 1.4% |
| Hartford, CT | 5,512 | -6.3% | -4.2% |
| Houston, TX | 27,150 | -5.2% | -1.6% |
| Indianapolis, IN | 5,467 | -6.0% | -16.3% |
| Knoxville, TN | 4,110 | 4.6% | 12.5% |
| Las Vegas, NV | 10,683 | -6.0% | 6.7% |
| Los Angeles, CA | 17,054 | -8.5% | -15.5% |
| Louisville, KY | 3,411 | -2.4% | -3.5% |
| McAllen, TX | 1,832 | -5.3% | -7.3% |
| Memphis, TN | 2,858 | -4.8% | -10.9% |
| Miami, FL | 18,118 | 0.4% | -4.4% |
| Milwaukee, WI | 5,188 | -5.1% | -2.1% |
| Minneapolis, MN | 11,060 | -8.5% | -3.8% |
| Montgomery County, PA | 5,912 | -8.1% | -12.4% |
| Nashville, TN | 11,033 | -2.1% | -3.8% |
| Nassau County, NY | 10,947 | -7.3% | -4.6% |
| New Brunswick, NJ | 11,933 | -7.4% | -11.2% |
| New Haven, CT | 3,744 | -6.6% | -7.6% |
| New Orleans, LA | 4,362 | -4.9% | -6.4% |
| New York, NY | 36,229 | 1.1% | -7.2% |
| Newark, NJ | 8,952 | -3.9% | -1.3% |
| North Port, FL | 6,161 | 1.7% | -13.5% |
| Oakland, CA | 3,508 | -13.8% | -15.3% |
| Oklahoma City, OK | 4,940 | -3.0% | -12.7% |
| Omaha, NE | 2,074 | -4.2% | -10.2% |
| Orlando, FL | 9,248 | -4.5% | -15.3% |
| Oxnard, CA | 2,063 | -8.2% | -0.8% |
| Philadelphia, PA | 7,033 | -2.5% | -0.6% |
| Phoenix, AZ | 16,131 | -0.3% | -20.8% |
| Pittsburgh, PA | 8,855 | -1.8% | -3.0% |
| Portland, OR | 6,961 | -9.1% | -12.7% |
| Providence, RI | 5,790 | -6.3% | -14.1% |
| Raleigh, NC | 6,320 | -3.7% | -4.6% |
| Richmond, VA | 3,446 | -1.9% | -6.9% |
| Riverside, CA | 14,557 | -6.7% | -18.1% |
| Rochester, NY | 1,928 | -4.7% | -18.8% |
| Sacramento, CA | 5,250 | -12.5% | -20.7% |
| Salt Lake City, UT | 2,518 | 4.6% | -44.6% |
| San Antonio, TX | 9,012 | -3.4% | 0.3% |
| San Diego, CA | 6,099 | -11.0% | -28.7% |
| San Francisco, CA | 2,074 | -4.0% | 2.2% |
| San Jose, CA | 2,185 | -15.7% | -15.5% |
| Seattle, WA | 6,463 | -13.8% | -24.0% |
| St. Louis, MO | 8,924 | 2.6% | -24.9% |
| Tacoma, WA | 1,727 | -14.7% | -32.9% |
| Tampa, FL | 12,336 | -4.0% | -14.7% |
| Tulsa, OK | 2,845 | 10.3% | -31.4% |
| Urban Honolulu, HI | 3,583 | -2.2% | 4.8% |
| Virginia Beach, VA | 5,938 | -7.8% | -18.5% |
| Warren, MI | 9,643 | -5.3% | 5.7% |
| Washington, DC | 13,069 | -7.1% | -18.9% |
| West Palm Beach, FL | 12,766 | 4.2% | -7.3% |
| Worcester, MA | 2,669 | -11.2% | -12.4% |
| National | 818,200 | -3.6% | -9.1% |
Median Off-Market Redfin Estimate
| Redfin Metro | Estimate | Month-Over-Month | Year-Over-Year |
|---|---|---|---|
| Albany, NY | $222,100 | 0.2% | 3.1% |
| Allentown, PA | $225,100 | 0.5% | 7.6% |
| Atlanta, GA | $234,200 | 0.5% | 8.6% |
| Austin, TX | $321,800 | 0.2% | 7.3% |
| Bakersfield, CA | $228,600 | 0.7% | 7.2% |
| Baltimore, MD | $267,700 | -0.1% | 5.2% |
| Baton Rouge, LA | $173,900 | 0.6% | 15.7% |
| Birmingham, AL | $155,000 | 0.4% | 3.7% |
| Boston, MA | $501,000 | 0.0% | 2.6% |
| Buffalo, NY | $167,600 | 0.4% | 6.9% |
| Camden, NJ | $206,300 | 0.2% | 7.0% |
| Charlotte, NC | $214,100 | 0.9% | 5.5% |
| Chicago, IL | $253,400 | 0.0% | 5.8% |
| Cincinnati, OH | $180,800 | 0.3% | 7.7% |
| Cleveland, OH | $149,800 | 1.1% | 8.6% |
| Columbus, OH | $204,500 | 0.7% | 9.3% |
| Dallas, TX | $269,500 | 0.8% | 5.5% |
| Dayton, OH | $126,600 | 0.6% | 8.2% |
| Denver, CO | $419,700 | 0.1% | 2.6% |
| Detroit, MI | $113,100 | 0.2% | 8.0% |
| Fort Lauderdale, FL | $273,300 | 0.1% | 5.0% |
| Fort Worth, TX | $228,000 | 1.0% | 7.9% |
| Fresno, CA | $265,000 | 0.4% | 4.9% |
| Grand Rapids, MI | $173,600 | 0.4% | 8.8% |
| Greenville, SC | $195,200 | 0.4% | 17.0% |
| Houston, TX | $216,000 | 0.3% | 4.9% |
| Indianapolis, IN | $171,800 | 0.4% | 8.2% |
| Kansas City, MO | $193,800 | 0.3% | 4.6% |
| Knoxville, TN | $184,100 | 0.6% | 23.8% |
| Las Vegas, NV | $283,000 | 0.5% | 4.0% |
| Los Angeles, CA | $640,700 | 0.2% | 2.6% |
| Louisville, KY | $178,200 | 0.1% | 18.8% |
| Memphis, TN | $148,600 | 0.4% | 10.9% |
| Miami, FL | $311,500 | 0.2% | 6.0% |
| Milwaukee, WI | $200,700 | -0.2% | -4.1% |
| Minneapolis, MN | $276,100 | 0.2% | 6.7% |
| Montgomery County, PA | $326,700 | 0.0% | 3.4% |
| Nashville, TN | $275,500 | 0.7% | 12.0% |
| New Orleans, LA | $190,400 | 0.3% | 13.4% |
| Newark, NJ | $384,800 | 0.2% | 7.7% |
| Oakland, CA | $770,900 | -0.2% | -0.4% |
| Oklahoma City, OK | $155,800 | 0.5% | 10.8% |
| Omaha, NE | $185,300 | 0.8% | 9.8% |
| Orlando, FL | $245,100 | 0.4% | 7.3% |
| Oxnard, CA | $609,800 | 0.0% | 1.0% |
| Philadelphia, PA | $194,200 | 0.2% | -5.3% |
| Phoenix, AZ | $283,900 | 0.7% | 7.4% |
| Pittsburgh, PA | $160,200 | 0.4% | 11.8% |
| Portland, OR | $406,200 | 0.0% | 3.8% |
| Providence, RI | $305,300 | -0.4% | 3.6% |
| Raleigh, NC | $280,300 | 0.7% | 6.8% |
| Richmond, VA | $236,700 | 0.4% | 6.9% |
| Riverside, CA | $377,400 | 0.4% | 3.8% |
| Rochester, NY | $154,600 | 0.5% | 7.9% |
| Sacramento, CA | $421,100 | -0.6% | 4.7% |
| Salt Lake City, UT | $346,000 | 0.6% | 7.3% |
| San Antonio, TX | $209,900 | 2.0% | 10.3% |
| San Diego, CA | $605,800 | 0.2% | 2.3% |
| San Francisco, CA | $1,340,000 | -0.3% | -1.8% |
| San Jose, CA | $1,147,800 | -0.6% | -8.3% |
| Seattle, WA | $576,000 | -0.5% | 1.8% |
| St. Louis, MO | $169,600 | 0.0% | 9.3% |
| Tacoma, WA | $373,700 | 0.0% | 8.5% |
| Tampa, FL | $231,700 | 0.3% | 7.9% |
| Tucson, AZ | $225,800 | 0.4% | 10.4% |
| Tulsa, OK | $144,700 | 0.4% | 4.0% |
| Warren, MI | $213,700 | 0.0% | 0.9% |
| Washington, DC | $401,900 | 0.2% | 3.9% |
| West Palm Beach, FL | $278,100 | 0.3% | 5.4% |
| Worcester, MA | $298,000 | 0.5% | 4.8% |
| National | $308,500 | -1.4% | 6.4% |
The post U.S. Home Prices up 5.4% in October appeared first on Redfin Blog.