Affordable Inland Metros Drew People from San Francisco, New York and Los Angeles
The fourth quarter of 2017 saw people in expensive, high-tax coastal markets like San Francisco, New York, Los Angeles, search for homes in metros like Sacramento, Phoenix, Las Vegas, and Nashville where taxes are lower and housing is more affordable. This is a continuation of a trend we saw throughout the past year, but what was new last quarter was that the topic of taxes and tax reform came in conversations Redfin agents had with people looking to move away from the aforementioned coastal markets and into fast-growing mid-tier metros. We expect that in 2018, this migration pattern will intensify as tax reform becomes a reality and more people choose to relocate in search of a lower cost of living. Our migration analysis is based on a sample of more than 1 million Redfin.com users searching for homes across 75 metro areas from October through December 2017.
Among the 22 percent of Redfin.com home searchers who looked to move to another metro area in the fourth quarter, the following key trends emerge:
- San Francisco, New York, Los Angeles, Washington, D.C. and Chicago posted the highest net outflows.
- Fast-growing, mid-tier metros in the Sunbelt, including Phoenix and Las Vegas, and the South, including Atlanta and Nashville, had the highest net inflows.
- Seattle saw more users looking to leave than to move to the area for the first time since we began tracking this data at the beginning of 2017.
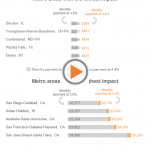
Moving Out – Metros with the Highest Net Outflow of Users
Tax reform limiting homeowners’ combined property tax and SALT deduction that Congress was proposing, debating and signing into law at the end of 2017 may have begun to influence migration patterns as seen in users’ search behavior in the fourth quarter. Tax savings are just one factor in people’s decisions to move, but they may play a larger role in the pursuit of affordability going forward.
“People leaving coastal hubs in search of affordability has been a consistent trend for the last five years,” said Redfin chief economist Nela Richardson. “Late last year there was a twist. Many of the popular migration paths that we saw Redfin.com users exploring yielded tax benefits along with increased affordability. We expect these trends to continue and will be monitoring them closely in 2018.”
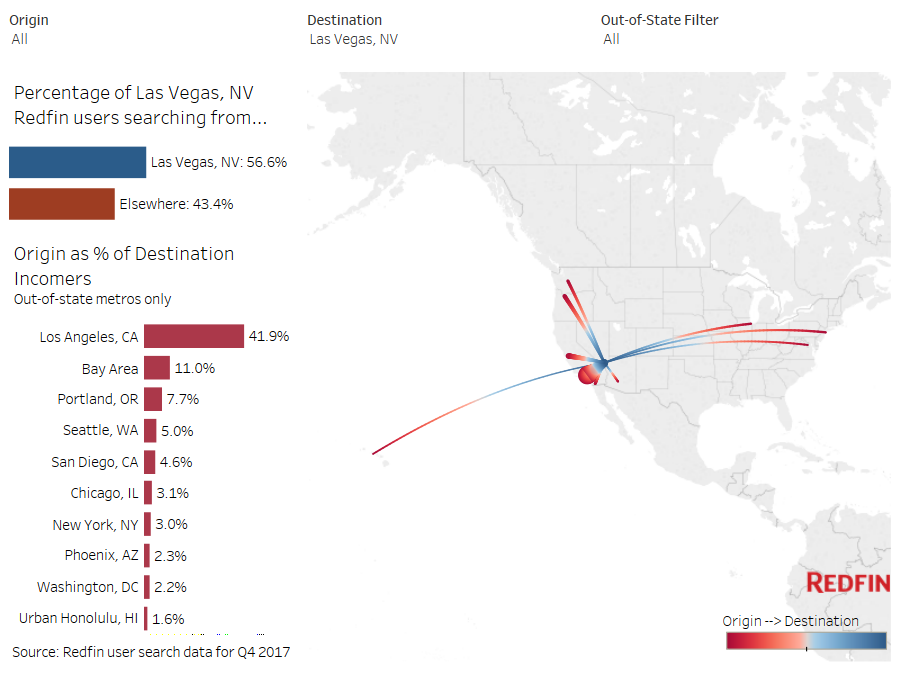
By comparing annual property, state and local tax burdens from the 2016 Tax Rates and Tax Burdens in the District of Columbia: A Nationwide Comparison report, we’re able to estimate what a move from one metro to another might entail from a tax perspective. For example, 18.2 percent of all Redfin.com searches for homes in Las Vegas in the fourth quarter came from Los Angeles; a family earning $150,000 who made this move could save $7,785 in taxes and would likely pay less for a similar home, given that the typical home in Las Vegas costs about $333,000 less than in Los Angeles. Similarly, the 9 percent of New Yorkers looking to leave who considered Atlanta might save $5,809 in taxes and benefit from around $161,000 lower median home sale price.
“Lower taxes and more affordable housing have historically drawn Californians away from the coast to places like Nevada and Arizona,” said Heidi Ludwig, a Redfin Agent in Hermosa Beach. “The recent changes in tax law have been coming up in my conversations with prospective home sellers. Last year, several of my home-selling clients followed their employer, Toyota, to its new facility in Plano, Texas. I expect to see more people move in the same direction this year, but for different reasons including taxes and overall affordability.”
Seattle showed a negative net outflow in the fourth quarter, a first since we began tracking migration patterns at the beginning of 2017. Among local users who were looking to leave, 10.6 percent were eyeing Los Angeles, followed by Bellingham, Wash., Portland and Phoenix, each of which captured at least 8 percent of Seattleites looking to leave.
| Table: Top 10 Metros by Net Outflow of Users and Their Top Destinations | |||||
| Rank | Metro* | Net Outflow† | Portion of Local Users Searching Elsewhere | Top Destination | Top Out-of-State Destination |
|---|---|---|---|---|---|
| 1 | San Francisco, CA | -15,489 | 19.4% | Sacramento, CA | Seattle, WA |
| 2 | New York, NY | -12,532 | 33.4% | Boston, MA | Boston, MA |
| 3 | Los Angeles, CA | -11,326 | 15.5% | San Diego, CA | Las Vegas, NV |
| 4 | Washington, DC | -3,892 | 10.2% | Philadelphia, PA | Philadelphia, PA |
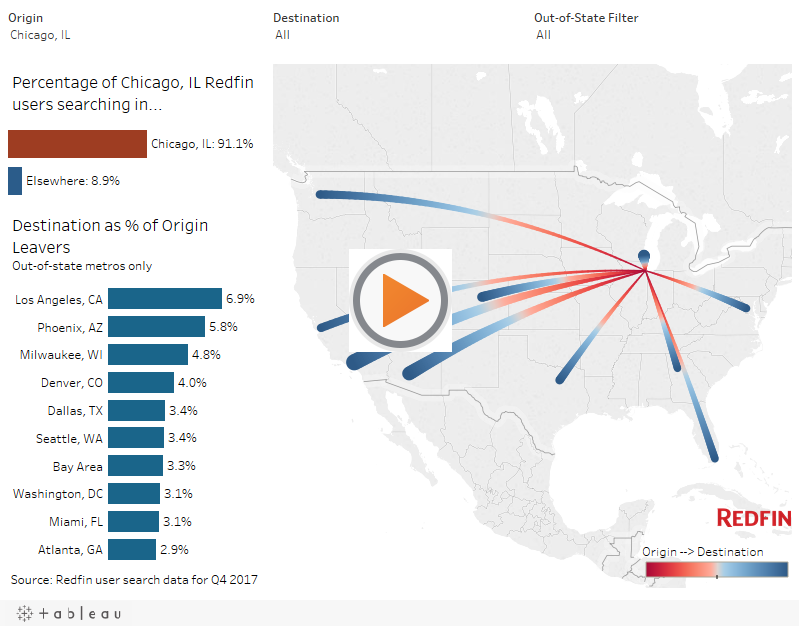
| 5 | Chicago, IL | -1,772 | 8.9% | Los Angeles, CA | Los Angeles, CA |
| 6 | Houston, TX | -321 | 24.9% | Austin, TX | Los Angeles, CA |
| 7 | Seattle, WA | -258 | 10.4% | Los Angeles, CA | Los Angeles, CA |
| 8 | Detroit, MI | -117 | 25.2% | Chicago, IL | Chicago, IL |
| 9 | Eugene, OR | -83 | 33.1% | Portland, OR | Seattle, WA |
| 10 | Omaha, NE | -50 | 29.6% | Las Vegas, NV | Las Vegas, NV |
| *Combined statistical areas with at least 500 users in Q4 2017 †Among the one million users sampled for this analysis only |
|||||
Moving In – Metros with the Highest Net Inflow of Users
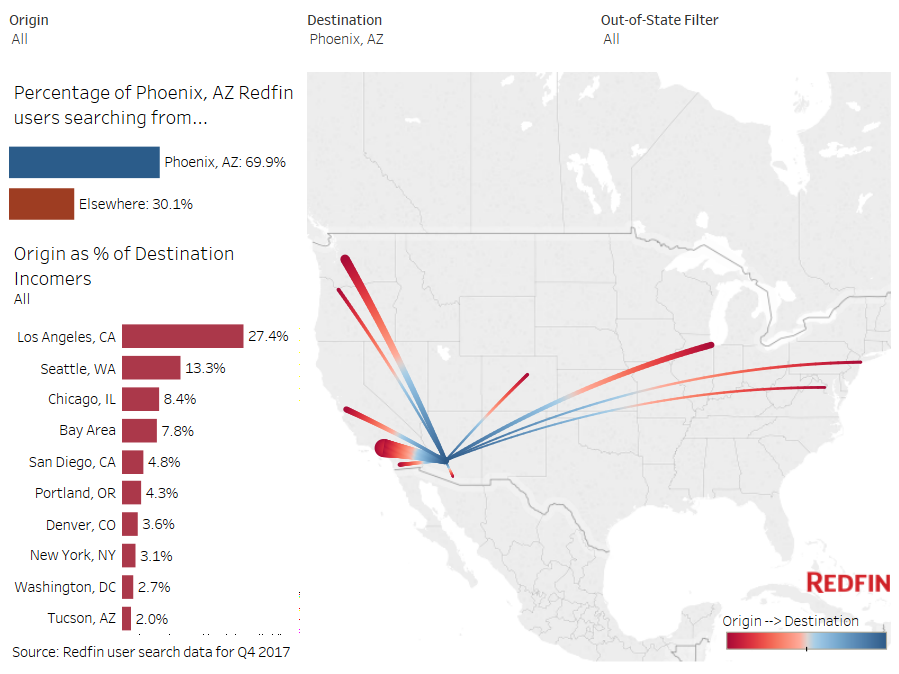
Metros in the Sun Belt (Phoenix and Las Vegas) and the South (Atlanta, Dallas, Nashville) were top destinations for home searches originating outside the local area, as we saw throughout 2017. These destination metros are noted for low state and local taxes compared the national average as well as lower median property taxes. San Francisco, Los Angeles and New York were the most common origins among users looking to relocate to these top destinations.
Over 43 percent of all searches for homes in the Las Vegas metro came from outside the area, drawing more out-of-towner attention than any other location in the analysis.
| Table: Top 10 Metros by Net Inflow of Users and Their Top Origins | |||||
| Rank | Metro* | Net Inflow† | Portion of Searches from Users Outside the Metro | Top Origin | Top Out-of-State Origin |
|---|---|---|---|---|---|
| 1 | Sacramento, CA | 4,101 | 37.7% | San Francisco, CA | Seattle, WA |
| 2 | Phoenix, AZ | 3,153 | 30.1% | Los Angeles, CA | Los Angeles, CA |
| 3 | Las Vegas, NV | 3,093 | 43.4% | Los Angeles, CA | Los Angeles, CA |
| 4 | San Diego, CA | 3,043 | 26.4% | Los Angeles, CA | Seattle, WA |
| 5 | Atlanta, GA | 2,700 | 25.9% | New York, NY | New York, NY |
| 6 | Portland, OR | 2,287 | 16.4% | San Francisco, CA | San Francisco, CA |
| 7 | Dallas, TX | 1,788 | 22.0% | Los Angeles, CA | Los Angeles, CA |
| 8 | Nashville, TN | 1,582 | 32.4% | New York, NY | New York, NY |
| 9 | Boston, MA | 1,574 | 12.6% | New York, NY | New York, NY |
| 10 | Austin, TX | 1,490 | 24.8% | San Francisco, CA | San Francisco, CA |
| *Combined statistical areas with at least 500 users in Q4 2017 †Among the one million users sampled for this analysis only |
|||||
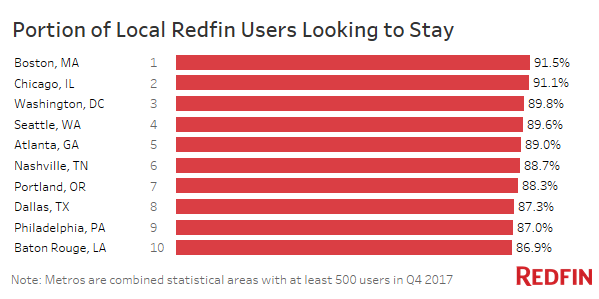
Staying Put
Across the 75 metro areas in our analysis, 78 percent of Redfin.com users looked for homes within their current metro. As we saw throughout 2017, Chicago, Boston, Washington, D,C. and Seattle metro areas continued to inspire loyalty with about nine of 10 users searching for homes in their local area.
Throughout all of 2017, less than 14 percent of users in Raleigh, Portland, Dallas, Atlanta, Washington D.C., Nashville, Chicago and Seattle looked to relocate.
As factors influencing people’s decisions regarding where to live evolve, Redfin search data reveals emerging migration patterns with home seekers shifting their search to lower-cost, second-tier markets and away from expensive coastal cities. We will continue to track migration using Redfin’s proprietary user dataset each quarter.
Find your Metro: On the below interactive map, select one metro area origin (or destination) to see the top 10 destinations (or origins) for that metro.
If you’d like more information about this analysis or its underlying data, please email press@redfin.com.
Methodology
Redfin analyzed a sample of more than 1 million Redfin.com users searching for homes across 75 metro areas from October through December. Users must have viewed at least 10 listings during the quarter. We also excluded locations that in aggregate represented less than 20 percent of a user’s searches. We determined the home metro by mapping the user’s IP address of the most common location they searched from. If a user was searching in more than one metro, we accounted for the share of searches in each metro. Combined Statistical Areas (as defined here) must have had at least 500 users either searching from or in that metro during the first quarter.
It’s worth noting that net inflow and outflow data does not account for Redfin’s market share or the population of metro areas. In metros where Redfin has a larger number of website visitors, we may have a higher volume of inbound and outbound searches than in metros that are smaller or where Redfin has a smaller user base. The U.S. Census Bureau measures net migration flows, which is a common practice when analyzing migratory patterns.
The post Affordable Inland Metros Drew People from San Francisco, New York and Los Angeles appeared first on Redfin Real-Time.