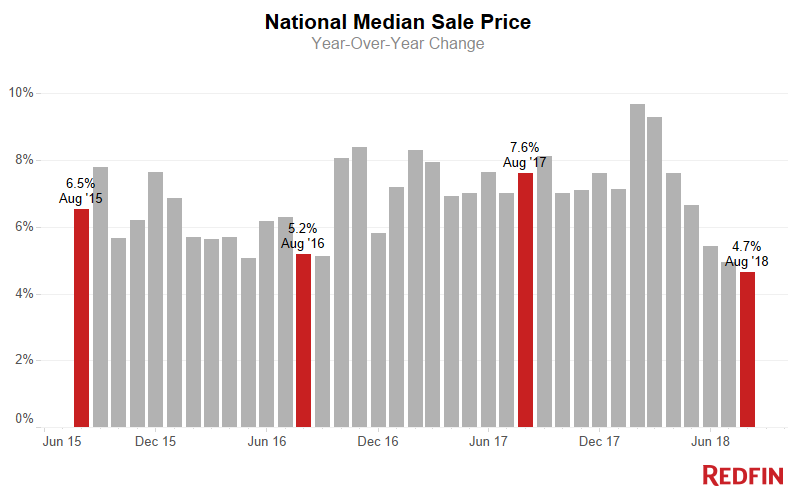
Home Prices Up 4.7% in August, Lowest Price Growth in Four Years
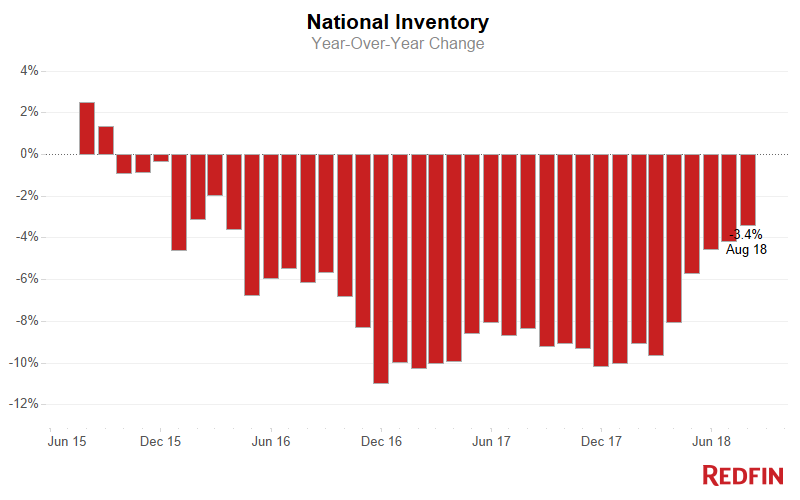
August Home Sales Fell 2.4%, as Inventory Declined Just 3.4% from Last Year
U.S. home-sale prices increased 4.7 percent in August to a median of $300,900, compared to a year ago. The price growth rate has been dropping for six consecutive months and has not been this low since August 2014. Homes sales fell 2.4 percent in August compared to a year prior.
Inventory declines continued to moderate in August. The number of homes for sale was down 3.4 percent year over year, the smallest decline in 29 months. The number of homes that were newly put on the market in August grew 3.3 percent year over year, helping to ease the supply shortage. The typical home that sold in August went under contract in a median of 37 days, three days faster than August 2017.
| Market Summary | August 2018 | Month-Over-Month | Year-Over-Year |
|---|---|---|---|
| Median sale price | $300,900 | -0.6% | 4.7% |
| Homes sold | 266,400 | -2.1% | -2.4% |
| New listings | 302,700 | -1.1% | 3.3% |
| All Homes for sale | 723,200 | -1.0% | -3.4% |
| Median days on market | 37 | 2 | -3 |
| Months of supply | 2.7 | 0 | 0 |
| Sold above list | 23.6% | -2.6% | -1.3% |
| Median Off-Market Redfin Estimate | $293,700 | 0.2% | 8.0% |
| Average Sale-to-list | 98.4% | 0.0% | -0.1% |
While homes are still selling at a rapid clip, other data points to waning competition. The share of homes that sold above asking price declined from 25 percent last August to 23.6 percent this August.
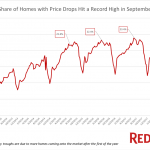
“While sale prices moderate, new listing prices keep accelerating,” said Redfin senior economist Taylor Marr. “This mismatch between seller expectations and reality is fueling an increase in price drops in metros across the country.”
Nearly 30 percent of homes on the market in August had a price drop, the largest share on record since Redfin began tracking this metric in 2009, and a 3.4 percentage-point increase over last August. It’s worth noting that the share of homes with price drops typically peaks each year in July or August.
Metro Trends
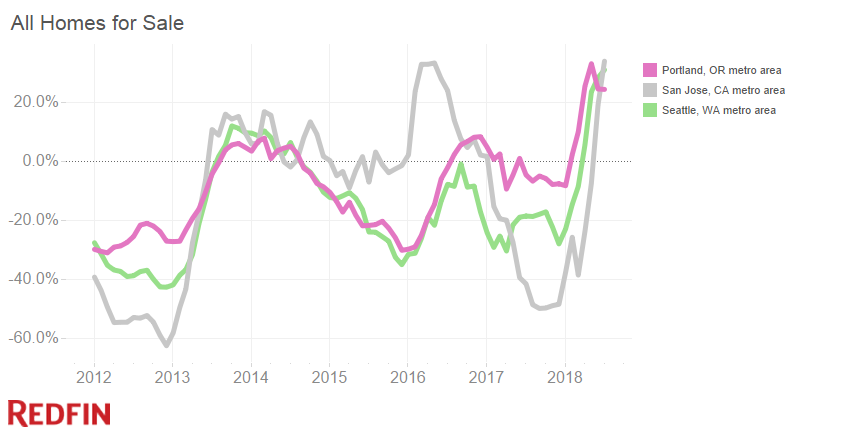
Redfin has been closely tracking a market shift in San Jose, California, Seattle, and Portland, Oregon, over the past three months. The trends of increasing inventory and declining sales we reported in June and July intensified in August.
In San Jose and Seattle, the supply of homes was up nearly 50 percent year over year. In Portland, inventory increased 25 percent. The increase in inventory is the combination of more people putting their homes on the market as fewer buyers are stepping up to purchase. San Jose, Seattle and Portland saw respective sales declines of 16 percent, 19 percent and 6 percent.
These markets continue to slow, with homes staying on the market longer than last year. In Portland, homes were on the market for a median of 21 days before finding a buyer, 10 days longer than last August. In San Jose, the median of 20 days on market is six days longer than a year prior. At 12 median days on market, Seattle was the second fastest market in the country, but homes still took four days longer to sell this August, compared to August of last year.
In Seattle, home prices were up 6 percent year over year, the lowest price growth in nearly three years. In San Jose and Portland, home prices rose 22 percent and 7 percent year over year respectively.
Rebecca Walter, a Redfin agent in Portland, says the market shift has been dramatic. She is seeing far fewer multiple offer situations lately compared to last year, even in popular neighborhoods. Walter says in this market, pricing right is more important than ever.
“I tell sellers that the worst thing you can do is overprice your home. If you have to drop the price, you can’t recreate the same excitement and fervor as when your home first hits the market. Pricing too high can ultimately result in getting less than market value, below what you likely could have gotten if you priced at market value from the start.”
Walter says rapid price appreciation has left many would-be Portland buyers priced out of the market and some are opting to move somewhere more affordable . She says homeowners who are thinking about selling should consider doing so sooner rather than later.
“I don’t have a crystal ball, but I wouldn’t count on your home appreciating and being worth more in the spring than it is now. The Fed has indicated they will make one more rate hike in December, which would impact buyers’ purchasing power. We have this window before the market slows for the holidays, so the sooner the better if you’re planning to sell.”
Other August Highlights
Speed and Competition
- Boston was the fastest market, with half of all homes pending sale in just 12 days, down from 13 days from a year earlier. Seattle was the next fastest market with 12 median days on market, followed by Denver, Grand Rapids, MI and Omaha, NE with 13.
- The most competitive market in August was San Francisco where 72.3% of homes sold above list price, followed by 69.1% in San Jose, CA, 62.7% in Oakland, CA, 44.3% in Boston, and 43.7% in Buffalo, NY.
Prices
- San Jose, CA had the nation’s highest price growth, rising 22.3% since last year to $1,189,000. Las Vegas had the second highest growth at 12.2% year-over-year price growth, followed by Tacoma, WA (12.1%), San Francisco (12%), and Grand Rapids, MI (10.8%).
- Chicago was the only major metro to see a price decline in August (-0.5%).
Sales
- Seattle saw the largest decline in sales compared to last year, falling 18.5%. Home sales in San Jose, CA and West Palm Beach, FL declined by 15.6% and 12.5%, respectively.
- Three out of 71 metros saw sales surge by double digits from last year. Houston led the nation in year-over-year sales growth, up 37.2%. The year-over-year spike in Houston home sales is attributable to Hurricane Harvey, which hit Houston in August of last year, causing sales to tumble.
- Sales in Camden, NJ increased 24.6%, while New Orleans rounded out the top three with sales up 10.4% from a year ago.
Inventory
- San Jose, CA had the highest increase in the number of homes for sale, up 49.1% year over year, followed by Seattle (46.4%) and San Diego (26.2%).
- Indianapolis had the largest decrease in overall inventory, falling 22.9% since last August. Rochester, NY (-20.8%), Milwaukee (-19.0%), and Las Vegas (-18.7%) also saw far fewer homes available on the market than a year ago.
Redfin Estimate
- The median list price-to-Redfin Estimate ratio was 92.2% in San Francisco, CA, the lowest of any market. This indicates the typical home for sale in August was listed at a price 94.0% of its estimated value. Only 6.0% of homes in San Francisco, CA were listed for more than their Redfin Estimate.
- Conversely, the median list price-to-Redfin Estimate ratio was 102.2% in Miami, FL and 102.0% in West Palm Beach, FL, which means sellers are listing their homes for more than the estimated value in those metro areas. In Miami, FL, 81.2% of homes were listed above their Redfin Estimate, the highest percentage of any metro.
Below are market-by-market breakdowns for prices, inventory, new listings and sales for markets with populations of 750 thousand or more. For downloadable data on all of the markets Redfin tracks, visit the Redfin Data Center.
EDITOR’S NOTE: The Washington, D.C. and Baltimore metro areas were excluded from this report and analysis due to data accuracy issues. The issues stem from problems with the listings information that Redfin receives from the MLS. Redfin engineers are working with the MLS to resolve the issue, which does not impact the ability to view homes for sale in the Washington and Baltimore metro areas on Redfin.com.
Median Sale Price
| Redfin Metro | Median Sale Price | Month-Over-Month | Year-Over-Year |
|---|---|---|---|
| Albany, NY | $218,500 | -2.9% | 4.1% |
| Allentown, PA | $210,000 | 2.0% | 2.4% |
| Atlanta, GA | $232,000 | -3.7% | 5.5% |
| Austin, TX | $317,000 | 0.6% | 7.5% |
| Bakersfield, CA | $239,900 | 0.0% | 9.0% |
| Baton Rouge, LA | $204,900 | 0.0% | 5.1% |
| Birmingham, AL | $203,500 | -3.1% | 5.8% |
| Boston, MA | $500,000 | -2.2% | 7.5% |
| Buffalo, NY | $156,600 | -5.1% | 4.4% |
| Camden, NJ | $190,000 | 1.6% | 5.6% |
| Charlotte, NC | $249,000 | 1.2% | 7.5% |
| Chicago, IL | $240,000 | -5.8% | -0.5% |
| Cincinnati, OH | $182,500 | -1.3% | 2.3% |
| Cleveland, OH | $155,000 | 1.8% | 8.4% |
| Columbus, OH | $209,200 | -1.1% | 7.5% |
| Dallas, TX | $293,100 | -2.3% | 4.7% |
| Denver, CO | $404,400 | -1.4% | 7.9% |
| Detroit, MI | $135,000 | -3.6% | 1.1% |
| Fort Lauderdale, FL | $270,000 | 3.0% | 3.8% |
| Fort Worth, TX | $240,000 | -2.0% | 6.7% |
| Fresno, CA | $275,000 | 1.9% | 7.8% |
| Grand Rapids, MI | $205,000 | 0.5% | 10.8% |
| Greenville, SC | $198,300 | -5.6% | 1.2% |
| Hampton Roads, VA | $232,000 | 0.9% | 1.4% |
| Honolulu, HI | $588,500 | -0.8% | 3.8% |
| Houston, TX | $238,000 | -2.3% | 2.1% |
| Indianapolis, IN | $178,000 | -1.9% | 8.4% |
| Jacksonville, FL | $225,000 | -2.2% | 7.1% |
| Kansas City, MO | $205,000 | -4.7% | 2.8% |
| Knoxville, TN | $195,000 | -2.5% | 8.3% |
| Las Vegas, NV | $275,000 | 1.3% | 12.2% |
| Long Island, NY | $470,000 | 2.2% | 10.6% |
| Los Angeles, CA | $625,000 | 0.0% | 5.9% |
| Louisville, KY | $195,000 | -4.9% | 9.6% |
| Memphis, TN | $175,000 | -7.2% | 3.0% |
| Miami, FL | $295,000 | 0.0% | 3.5% |
| Milwaukee, WI | $218,000 | -5.2% | 4.2% |
| Minneapolis, MN | $268,000 | 0.0% | 5.5% |
| Montgomery County, PA | $316,500 | -2.8% | 0.5% |
| Nashville, TN | $294,900 | 0.0% | 7.2% |
| New Orleans, LA | $218,000 | -3.4% | 9.5% |
| Oakland, CA | $745,000 | -2.6% | 8.5% |
| Oklahoma City, OK | $172,900 | -1.2% | 4.8% |
| Omaha, NE | $198,000 | -5.0% | 7.0% |
| Orange County, CA | $710,000 | -1.4% | 6.8% |
| Orlando, FL | $245,000 | 0.0% | 8.4% |
| Oxnard, CA | $599,000 | -1.0% | 3.3% |
| Philadelphia, PA | $210,000 | 2.4% | 5.5% |
| Phoenix, AZ | $265,000 | -0.7% | 8.2% |
| Pittsburgh, PA | $170,000 | -1.7% | 3.0% |
| Portland, OR | $400,000 | 1.3% | 6.7% |
| Providence, RI | $274,900 | 0.0% | 7.8% |
| Raleigh, NC | $283,000 | -0.7% | 6.8% |
| Richmond, VA | $250,000 | -1.6% | 2.1% |
| Riverside, CA | $360,000 | -1.6% | 5.9% |
| Rochester, NY | $150,000 | 0.0% | 3.8% |
| Sacramento, CA | $390,000 | -2.5% | 2.6% |
| Salt Lake City, UT | $314,900 | -2.9% | 9.9% |
| San Antonio, TX | $227,500 | 1.1% | 5.8% |
| San Diego, CA | $585,000 | 0.0% | 6.4% |
| San Francisco, CA | $1,388,000 | -0.9% | 12.0% |
| San Jose, CA | $1,189,000 | 1.8% | 22.3% |
| Seattle, WA | $550,000 | -4.3% | 5.8% |
| St. Louis, MO | $183,000 | -1.0% | 6.1% |
| Tacoma, WA | $352,000 | -0.8% | 12.1% |
| Tampa, FL | $226,000 | -0.4% | 7.1% |
| Tucson, AZ | $215,000 | 2.4% | 10.3% |
| Tulsa, OK | $168,300 | 1.1% | 4.4% |
| Warren, MI | $215,000 | -1.6% | 9.7% |
| West Palm Beach, FL | $270,000 | 0.0% | 3.1% |
| Worcester, MA | $275,000 | -1.8% | 0.0% |
| National | $300,900 | -0.6% | 4.7% |
Homes Sold
| Redfin Metro | Homes Sold | Month-Over-Month | Year-Over-Year |
|---|---|---|---|
| Albany, NY | 1,072 | 4.8% | 0.8% |
| Allentown, PA | 1,067 | 19.0% | 1.8% |
| Atlanta, GA | 9,945 | -21.3% | -10.2% |
| Austin, TX | 3,153 | -5.8% | -1.5% |
| Bakersfield, CA | 827 | 2.2% | 0.6% |
| Baton Rouge, LA | 951 | -9.9% | -6.9% |
| Birmingham, AL | 1,459 | -12.8% | -1.9% |
| Boston, MA | 5,834 | 2.8% | -0.8% |
| Buffalo, NY | 1,146 | 6.0% | -11.1% |
| Camden, NJ | 2,515 | -8.3% | 24.6% |
| Charlotte, NC | 4,105 | 2.3% | -1.0% |
| Chicago, IL | 11,121 | -15.4% | -8.6% |
| Cincinnati, OH | 2,511 | -2.0% | 0.1% |
| Cleveland, OH | 2,945 | 1.8% | -3.2% |
| Columbus, OH | 3,334 | 1.5% | 5.4% |
| Dallas, TX | 6,072 | -1.2% | -4.5% |
| Denver, CO | 5,880 | 7.2% | 5.4% |
| Detroit, MI | 2,286 | 3.5% | 3.7% |
| Fort Lauderdale, FL | 2,898 | -7.8% | -10.3% |
| Fort Worth, TX | 3,383 | -3.5% | -0.4% |
| Fresno, CA | 855 | 2.3% | -11.6% |
| Grand Rapids, MI | 1,679 | -9.3% | 0.4% |
| Greenville, SC | 1,232 | -2.4% | 0.4% |
| Hampton Roads, VA | 2,298 | -11.1% | -1.3% |
| Honolulu, HI | 878 | 7.2% | -7.0% |
| Houston, TX | 8,549 | 3.5% | 37.2% |
| Indianapolis, IN | 3,431 | 0.9% | 3.0% |
| Jacksonville, FL | 2,541 | -13.5% | -9.7% |
| Kansas City, MO | 3,665 | 0.6% | 6.8% |
| Knoxville, TN | 1,422 | 2.1% | -0.9% |
| Las Vegas, NV | 3,844 | -1.7% | -4.5% |
| Long Island, NY | 3,147 | 10.1% | -8.4% |
| Los Angeles, CA | 6,771 | 5.0% | -10.3% |
| Louisville, KY | 1,805 | 8.7% | 6.3% |
| Memphis, TN | 1,228 | -19.4% | -9.0% |
| Miami, FL | 2,457 | -3.9% | -8.4% |
| Milwaukee, WI | 1,937 | -5.7% | -3.1% |
| Minneapolis, MN | 6,856 | -2.4% | -0.7% |
| Montgomery County, PA | 3,378 | 10.7% | 9.6% |
| Nashville, TN | 3,741 | -0.9% | -0.3% |
| New Orleans, LA | 1,411 | -0.6% | 10.4% |
| Oakland, CA | 2,561 | -8.3% | -10.6% |
| Oklahoma City, OK | 2,020 | -11.5% | -5.2% |
| Omaha, NE | 1,387 | 4.6% | 4.1% |
| Orange County, CA | 2,788 | 1.3% | -12.4% |
| Orlando, FL | 4,204 | 0.1% | -2.5% |
| Oxnard, CA | 838 | 7.0% | -2.1% |
| Philadelphia, PA | 2,565 | -8.3% | -4.4% |
| Phoenix, AZ | 8,036 | -4.2% | -0.4% |
| Pittsburgh, PA | 2,641 | 1.3% | 4.7% |
| Portland, OR | 3,723 | 5.8% | -5.6% |
| Providence, RI | 2,131 | 6.0% | 0.9% |
| Raleigh, NC | 2,571 | -3.3% | -2.1% |
| Richmond, VA | 1,875 | -3.5% | -0.8% |
| Riverside, CA | 5,130 | 0.5% | -9.4% |
| Rochester, NY | 1,343 | 10.9% | -5.6% |
| Sacramento, CA | 2,953 | -0.7% | -11.1% |
| Salt Lake City, UT | 1,825 | 2.3% | -2.9% |
| San Antonio, TX | 2,885 | -1.1% | 3.4% |
| San Diego, CA | 3,176 | -3.6% | -12.2% |
| San Francisco, CA | 947 | -6.0% | -8.1% |
| San Jose, CA | 1,346 | 0.0% | -15.6% |
| Seattle, WA | 4,392 | -7.3% | -18.5% |
| St. Louis, MO | 4,115 | 1.4% | -0.1% |
| Tacoma, WA | 1,587 | -0.3% | -10.1% |
| Tampa, FL | 5,688 | 2.2% | -1.0% |
| Tucson, AZ | 1,474 | -1.5% | 3.7% |
| Tulsa, OK | 1,185 | -4.8% | 4.5% |
| Warren, MI | 4,221 | -3.8% | -8.7% |
| West Palm Beach, FL | 2,796 | -16.4% | -12.5% |
| Worcester, MA | 1,119 | -2.0% | -2.9% |
| National | 266,400 | -2.1% | -2.4% |
New Listings
| Redfin Metro | New Listings | Month-Over-Month | Year-Over-Year |
|---|---|---|---|
| Albany, NY | 1,103 | -9.9% | -4.9% |
| Albuquerque, NM | 1,414 | -4.9% | -2.5% |
| Allentown, PA | 1,213 | -4.7% | 12.5% |
| Atlanta, GA | 10,423 | -1.3% | -0.6% |
| Austin, TX | 3,798 | -0.4% | 14.8% |
| Bakersfield, CA | 1,052 | -1.4% | 1.1% |
| Baton Rouge, LA | 1,178 | -2.2% | -2.6% |
| Birmingham, AL | 1,604 | -2.8% | -2.7% |
| Boston, MA | 4,850 | -5.4% | 0.4% |
| Buffalo, NY | 1,441 | -7.6% | 1.1% |
| Camden, NJ | 2,204 | -1.3% | -5.4% |
| Charlotte, NC | 4,396 | -1.7% | 0.7% |
| Chicago, IL | 12,400 | -7.8% | 0.8% |
| Cincinnati, OH | 2,742 | -4.0% | 3.1% |
| Cleveland, OH | 3,254 | -10.2% | 0.5% |
| Columbus, OH | 3,397 | -3.5% | -0.4% |
| Dallas, TX | 7,259 | -7.0% | 2.7% |
| Denver, CO | 5,707 | 1.5% | -0.1% |
| Detroit, MI | 3,003 | 6.5% | 8.5% |
| Fort Lauderdale, FL | 4,078 | 2.8% | 2.6% |
| Fort Worth, TX | 3,871 | -6.5% | 5.2% |
| Fresno, CA | 1,053 | -3.6% | -2.7% |
| Grand Rapids, MI | 1,953 | 7.4% | 4.9% |
| Greenville, SC | 1,346 | 3.9% | 2.0% |
| Hampton Roads, VA | 2,640 | 5.0% | 2.1% |
| Honolulu, HI | 988 | -14.8% | -6.4% |
| Houston, TX | 10,125 | -7.0% | 23.0% |
| Indianapolis, IN | 3,694 | 1.3% | 6.9% |
| Jacksonville, FL | 2,934 | -6.2% | -3.2% |
| Kansas City, MO | 3,935 | -2.1% | 12.5% |
| Knoxville, TN | 1,604 | -3.7% | 15.8% |
| Las Vegas, NV | 4,962 | 13.2% | 17.1% |
| Long Island, NY | 3,295 | -11.3% | 5.4% |
| Los Angeles, CA | 8,338 | -0.7% | 2.3% |
| Louisville, KY | 1,760 | -2.8% | 6.5% |
| Memphis, TN | 1,446 | -3.1% | -6.0% |
| Miami, FL | 4,347 | 7.1% | 0.1% |
| Milwaukee, WI | 2,149 | -0.6% | 2.3% |
| Minneapolis, MN | 6,722 | -0.1% | 5.5% |
| Montgomery County, PA | 2,595 | -6.1% | -6.1% |
| Nashville, TN | 4,511 | -0.6% | 9.6% |
| New Orleans, LA | 1,535 | -5.1% | 1.2% |
| Oakland, CA | 2,970 | -2.3% | 6.6% |
| Oklahoma City, OK | 2,123 | -6.8% | -4.2% |
| Omaha, NE | 1,430 | -1.5% | 4.4% |
| Orange County, CA | 3,293 | -3.7% | 2.7% |
| Orlando, FL | 4,687 | 1.5% | 3.5% |
| Oxnard, CA | 990 | 1.5% | 2.9% |
| Philadelphia, PA | 2,816 | -0.5% | -0.8% |
| Phoenix, AZ | 8,912 | 10.3% | 0.3% |
| Pittsburgh, PA | 2,722 | -7.1% | -2.7% |
| Portland, OR | 4,172 | -1.9% | 3.3% |
| Providence, RI | 2,475 | -0.7% | 3.8% |
| Raleigh, NC | 2,568 | 3.9% | 2.6% |
| Richmond, VA | 1,889 | -2.0% | -0.8% |
| Riverside, CA | 6,386 | 3.8% | 3.8% |
| Rochester, NY | 1,333 | -3.3% | 0.9% |
| Sacramento, CA | 3,934 | 8.3% | 2.6% |
| Salt Lake City, UT | 2,365 | 12.9% | 0.5% |
| San Antonio, TX | 3,431 | -4.4% | 7.4% |
| San Diego, CA | 4,086 | 1.6% | 6.1% |
| San Francisco, CA | 1,019 | -2.7% | 4.1% |
| San Jose, CA | 1,513 | -8.4% | 8.8% |
| Seattle, WA | 5,241 | -4.8% | -2.7% |
| St. Louis, MO | 4,608 | -3.4% | 3.9% |
| Tacoma, WA | 1,864 | 1.4% | 3.8% |
| Tampa, FL | 6,233 | 4.8% | 3.4% |
| Tucson, AZ | 1,749 | 15.8% | 11.4% |
| Tulsa, OK | 1,415 | -2.7% | 5.5% |
| Warren, MI | 5,115 | -3.9% | -1.7% |
| West Palm Beach, FL | 3,567 | 5.1% | -1.3% |
| Worcester, MA | 1,283 | 5.3% | 6.7% |
| National | 302,700 | -1.1% | 3.3% |
All Homes for Sale
| Redfin Metro | All Homes for Sale | Month-Over-Month | Year-Over-Year |
|---|---|---|---|
| Albany, NY | 3,027 | -2.7% | -11.7% |
| Albuquerque, NM | 4,565 | 6.9% | -1.9% |
| Allentown, PA | 3,560 | 15.8% | 20.2% |
| Atlanta, GA | 27,552 | -6.3% | -17.2% |
| Austin, TX | 8,601 | 0.5% | -1.1% |
| Bakersfield, CA | 2,322 | 0.0% | 0.9% |
| Baton Rouge, LA | 4,072 | -3.4% | 19.7% |
| Birmingham, AL | 4,898 | -2.9% | -16.4% |
| Boston, MA | 8,273 | -3.6% | 1.4% |
| Buffalo, NY | 2,408 | 3.6% | -12.8% |
| Camden, NJ | 7,395 | 0.5% | -6.7% |
| Charlotte, NC | 11,356 | -1.9% | -14.1% |
| Chicago, IL | 40,435 | -2.8% | -3.0% |
| Cincinnati, OH | 7,728 | -1.0% | -2.6% |
| Cleveland, OH | 8,880 | -2.1% | -6.1% |
| Columbus, OH | 7,005 | -0.1% | -4.6% |
| Dallas, TX | 17,245 | -5.6% | 10.7% |
| Denver, CO | 8,009 | 5.4% | 4.9% |
| Detroit, MI | 5,231 | 6.1% | 2.8% |
| Fort Lauderdale, FL | 13,004 | -2.0% | -1.4% |
| Fort Worth, TX | 7,571 | -6.7% | 4.5% |
| Fresno, CA | 1,815 | -0.3% | 2.5% |
| Grand Rapids, MI | 2,819 | 6.6% | -4.0% |
| Greenville, SC | 4,030 | 0.9% | -1.7% |
| Hampton Roads, VA | 7,352 | -3.0% | -12.7% |
| Honolulu, HI | 3,453 | -1.5% | 9.3% |
| Houston, TX | 28,200 | -2.5% | -3.5% |
| Indianapolis, IN | 6,043 | 1.5% | -22.9% |
| Jacksonville, FL | 7,757 | -2.6% | 6.6% |
| Knoxville, TN | 4,786 | -2.6% | 1.4% |
| Las Vegas, NV | 8,375 | 14.3% | -18.7% |
| Long Island, NY | 11,258 | -4.7% | 0.9% |
| Los Angeles, CA | 17,892 | -2.0% | 1.9% |
| Louisville, KY | 3,297 | 0.6% | -5.0% |
| Memphis, TN | 3,145 | -5.6% | -9.6% |
| Miami, FL | 17,231 | -1.1% | -3.3% |
| Milwaukee, WI | 5,193 | 0.2% | -19.0% |
| Minneapolis, MN | 11,964 | 2.4% | -5.5% |
| Montgomery County, PA | 6,931 | -2.3% | -12.1% |
| Nashville, TN | 11,337 | 1.7% | 20.7% |
| New Orleans, LA | 5,774 | -5.7% | -1.8% |
| Oakland, CA | 3,573 | 2.5% | 21.2% |
| Oklahoma City, OK | 5,448 | -1.4% | -16.6% |
| Omaha, NE | 2,205 | 7.5% | -5.8% |
| Orange County, CA | 8,285 | -2.7% | 4.0% |
| Orlando, FL | 9,654 | -1.7% | -11.2% |
| Oxnard, CA | 2,037 | 2.0% | 20.2% |
| Philadelphia, PA | 6,909 | 3.2% | -12.4% |
| Phoenix, AZ | 17,735 | -1.8% | -10.8% |
| Pittsburgh, PA | 9,052 | -6.6% | -14.8% |
| Portland, OR | 7,799 | 3.7% | 25.0% |
| Providence, RI | 6,166 | -1.3% | 1.6% |
| Raleigh, NC | 6,230 | -3.8% | -7.3% |
| Richmond, VA | 3,688 | 0.6% | -10.1% |
| Riverside, CA | 16,070 | -2.0% | 3.0% |
| Rochester, NY | 2,215 | -0.4% | -20.8% |
| Sacramento, CA | 6,396 | 7.1% | 8.0% |
| Salt Lake City, UT | 3,590 | -10.0% | -10.1% |
| San Antonio, TX | 8,287 | -6.6% | -5.9% |
| San Diego, CA | 7,875 | 4.5% | 26.2% |
| San Francisco, CA | 1,312 | -6.3% | 8.2% |
| San Jose, CA | 1,963 | -5.7% | 49.1% |
| Seattle, WA | 8,021 | 11.1% | 46.4% |
| St. Louis, MO | 12,060 | -4.2% | -8.3% |
| Tacoma, WA | 2,740 | 7.8% | -2.4% |
| Tampa, FL | 12,640 | -1.8% | -3.5% |
| Tucson, AZ | 4,200 | -2.4% | -7.8% |
| Tulsa, OK | 4,005 | -4.1% | -6.4% |
| Warren, MI | 9,367 | 4.6% | 0.2% |
| West Palm Beach, FL | 13,003 | -2.9% | -1.5% |
| Worcester, MA | 2,356 | 2.8% | 0.3% |
| National | 723,200 | -1.0% | -3.4% |
Median Off-Market Redfin Estimate
| Redfin Metro | Estimate | Month-Over-Month | Year-Over-Year |
|---|---|---|---|
| Albany, NY | $213,900 | 0.8% | 4.5% |
| Allentown, PA | $206,100 | 0.8% | 6.0% |
| Atlanta, GA | $210,900 | 1.1% | 11.6% |
| Austin, TX | $298,400 | 0.2% | 3.5% |
| Bakersfield, CA | $210,000 | 0.4% | 5.9% |
| Baton Rouge, LA | $150,800 | 0.4% | -1.0% |
| Birmingham, AL | $146,200 | 0.4% | 5.8% |
| Boston, MA | $487,500 | 0.6% | 7.0% |
| Buffalo, NY | $154,600 | 1.1% | 6.5% |
| Camden, NJ | $193,100 | 0.8% | 3.9% |
| Charlotte, NC | $199,700 | 0.9% | 14.8% |
| Chicago, IL | $237,300 | 0.4% | 2.7% |
| Cincinnati, OH | $166,600 | 0.7% | 9.1% |
| Cleveland, OH | $136,200 | 0.6% | 5.1% |
| Columbus, OH | $185,900 | 0.7% | 10.9% |
| Dallas, TX | $253,600 | 0.5% | 8.4% |
| Denver, CO | $407,900 | 0.2% | 9.1% |
| Detroit, MI | $102,300 | 1.3% | 26.7% |
| Fort Lauderdale, FL | $256,400 | 0.4% | 7.9% |
| Fort Worth, TX | $209,200 | 0.6% | 10.2% |
| Fresno, CA | $250,900 | 0.4% | 8.4% |
| Grand Rapids, MI | $157,500 | 0.8% | 8.3% |
| Greenville, SC | $164,600 | 0.8% | 8.5% |
| Hampton Roads, VA | $222,400 | 0.3% | 4.1% |
| Honolulu, HI | $688,800 | 0.4% | 4.0% |
| Houston, TX | $203,800 | 0.5% | 6.3% |
| Indianapolis, IN | $157,100 | 0.9% | 8.8% |
| Jacksonville, FL | $212,600 | 1.1% | 10.2% |
| Kansas City, MO | $184,500 | 1.0% | 8.2% |
| Knoxville, TN | $146,700 | 0.8% | 8.2% |
| Las Vegas, NV | $267,900 | 1.4% | 17.1% |
| Long Island, NY | $433,000 | 0.6% | 5.6% |
| Los Angeles, CA | $619,400 | 0.5% | 7.9% |
| Louisville, KY | $149,000 | 0.8% | -3.4% |
| Memphis, TN | $133,000 | 0.6% | 8.3% |
| Miami, FL | $291,600 | 0.6% | 7.4% |
| Milwaukee, WI | $208,300 | 0.4% | 10.2% |
| Minneapolis, MN | $256,300 | 0.9% | 6.7% |
| Montgomery County, PA | $315,100 | 0.4% | 3.5% |
| Nashville, TN | $243,900 | 0.8% | 11.4% |
| New Orleans, LA | $165,800 | 0.3% | -5.4% |
| Oakland, CA | $774,000 | 0.3% | 10.3% |
| Oklahoma City, OK | $139,200 | 0.4% | 3.0% |
| Omaha, NE | $168,200 | 0.8% | 7.3% |
| Orange County, CA | $713,300 | 0.4% | 6.5% |
| Orlando, FL | $226,200 | 0.7% | 8.9% |
| Oxnard, CA | $599,300 | 0.4% | 5.0% |
| Philadelphia, PA | $206,500 | 1.6% | 13.4% |
| Phoenix, AZ | $262,400 | 0.5% | 7.5% |
| Pittsburgh, PA | $139,000 | 1.0% | 3.0% |
| Portland, OR | $390,700 | 0.2% | 5.8% |
| Providence, RI | $291,300 | 0.7% | 5.9% |
| Raleigh, NC | $259,600 | 0.8% | 7.1% |
| Richmond, VA | $220,000 | 0.4% | 6.9% |
| Riverside, CA | $360,700 | 0.6% | 8.6% |
| Rochester, NY | $142,400 | 0.6% | 5.2% |
| Sacramento, CA | $400,400 | 0.5% | 6.7% |
| Salt Lake City, UT | $319,300 | 0.6% | 9.2% |
| San Antonio, TX | $188,400 | 0.5% | 7.5% |
| San Diego, CA | $589,900 | 0.3% | 7.0% |
| San Francisco, CA | $1,349,700 | 0.0% | 12.4% |
| San Jose, CA | $1,273,400 | -0.8% | 22.7% |
| Seattle, WA | $567,000 | 0.1% | 12.6% |
| St. Louis, MO | $154,600 | 0.7% | 5.7% |
| Tacoma, WA | $342,900 | -0.6% | 12.8% |
| Tampa, FL | $213,100 | 0.5% | 9.2% |
| Tucson, AZ | $202,200 | 0.7% | 7.0% |
| Tulsa, OK | $136,900 | 0.7% | 2.6% |
| Warren, MI | $210,100 | 0.9% | 7.8% |
| West Palm Beach, FL | $261,600 | 0.2% | 6.5% |
| Worcester, MA | $282,200 | 0.9% | 7.7% |
| National | $293,700 | 0.2% | 8.0% |
The post Home Prices Up 4.7% in August, Lowest Price Growth in Four Years appeared first on Redfin Real-Time.