Hot or Not? Redfin Tests the Temperature of January’s Hottest Neighborhood Predictions
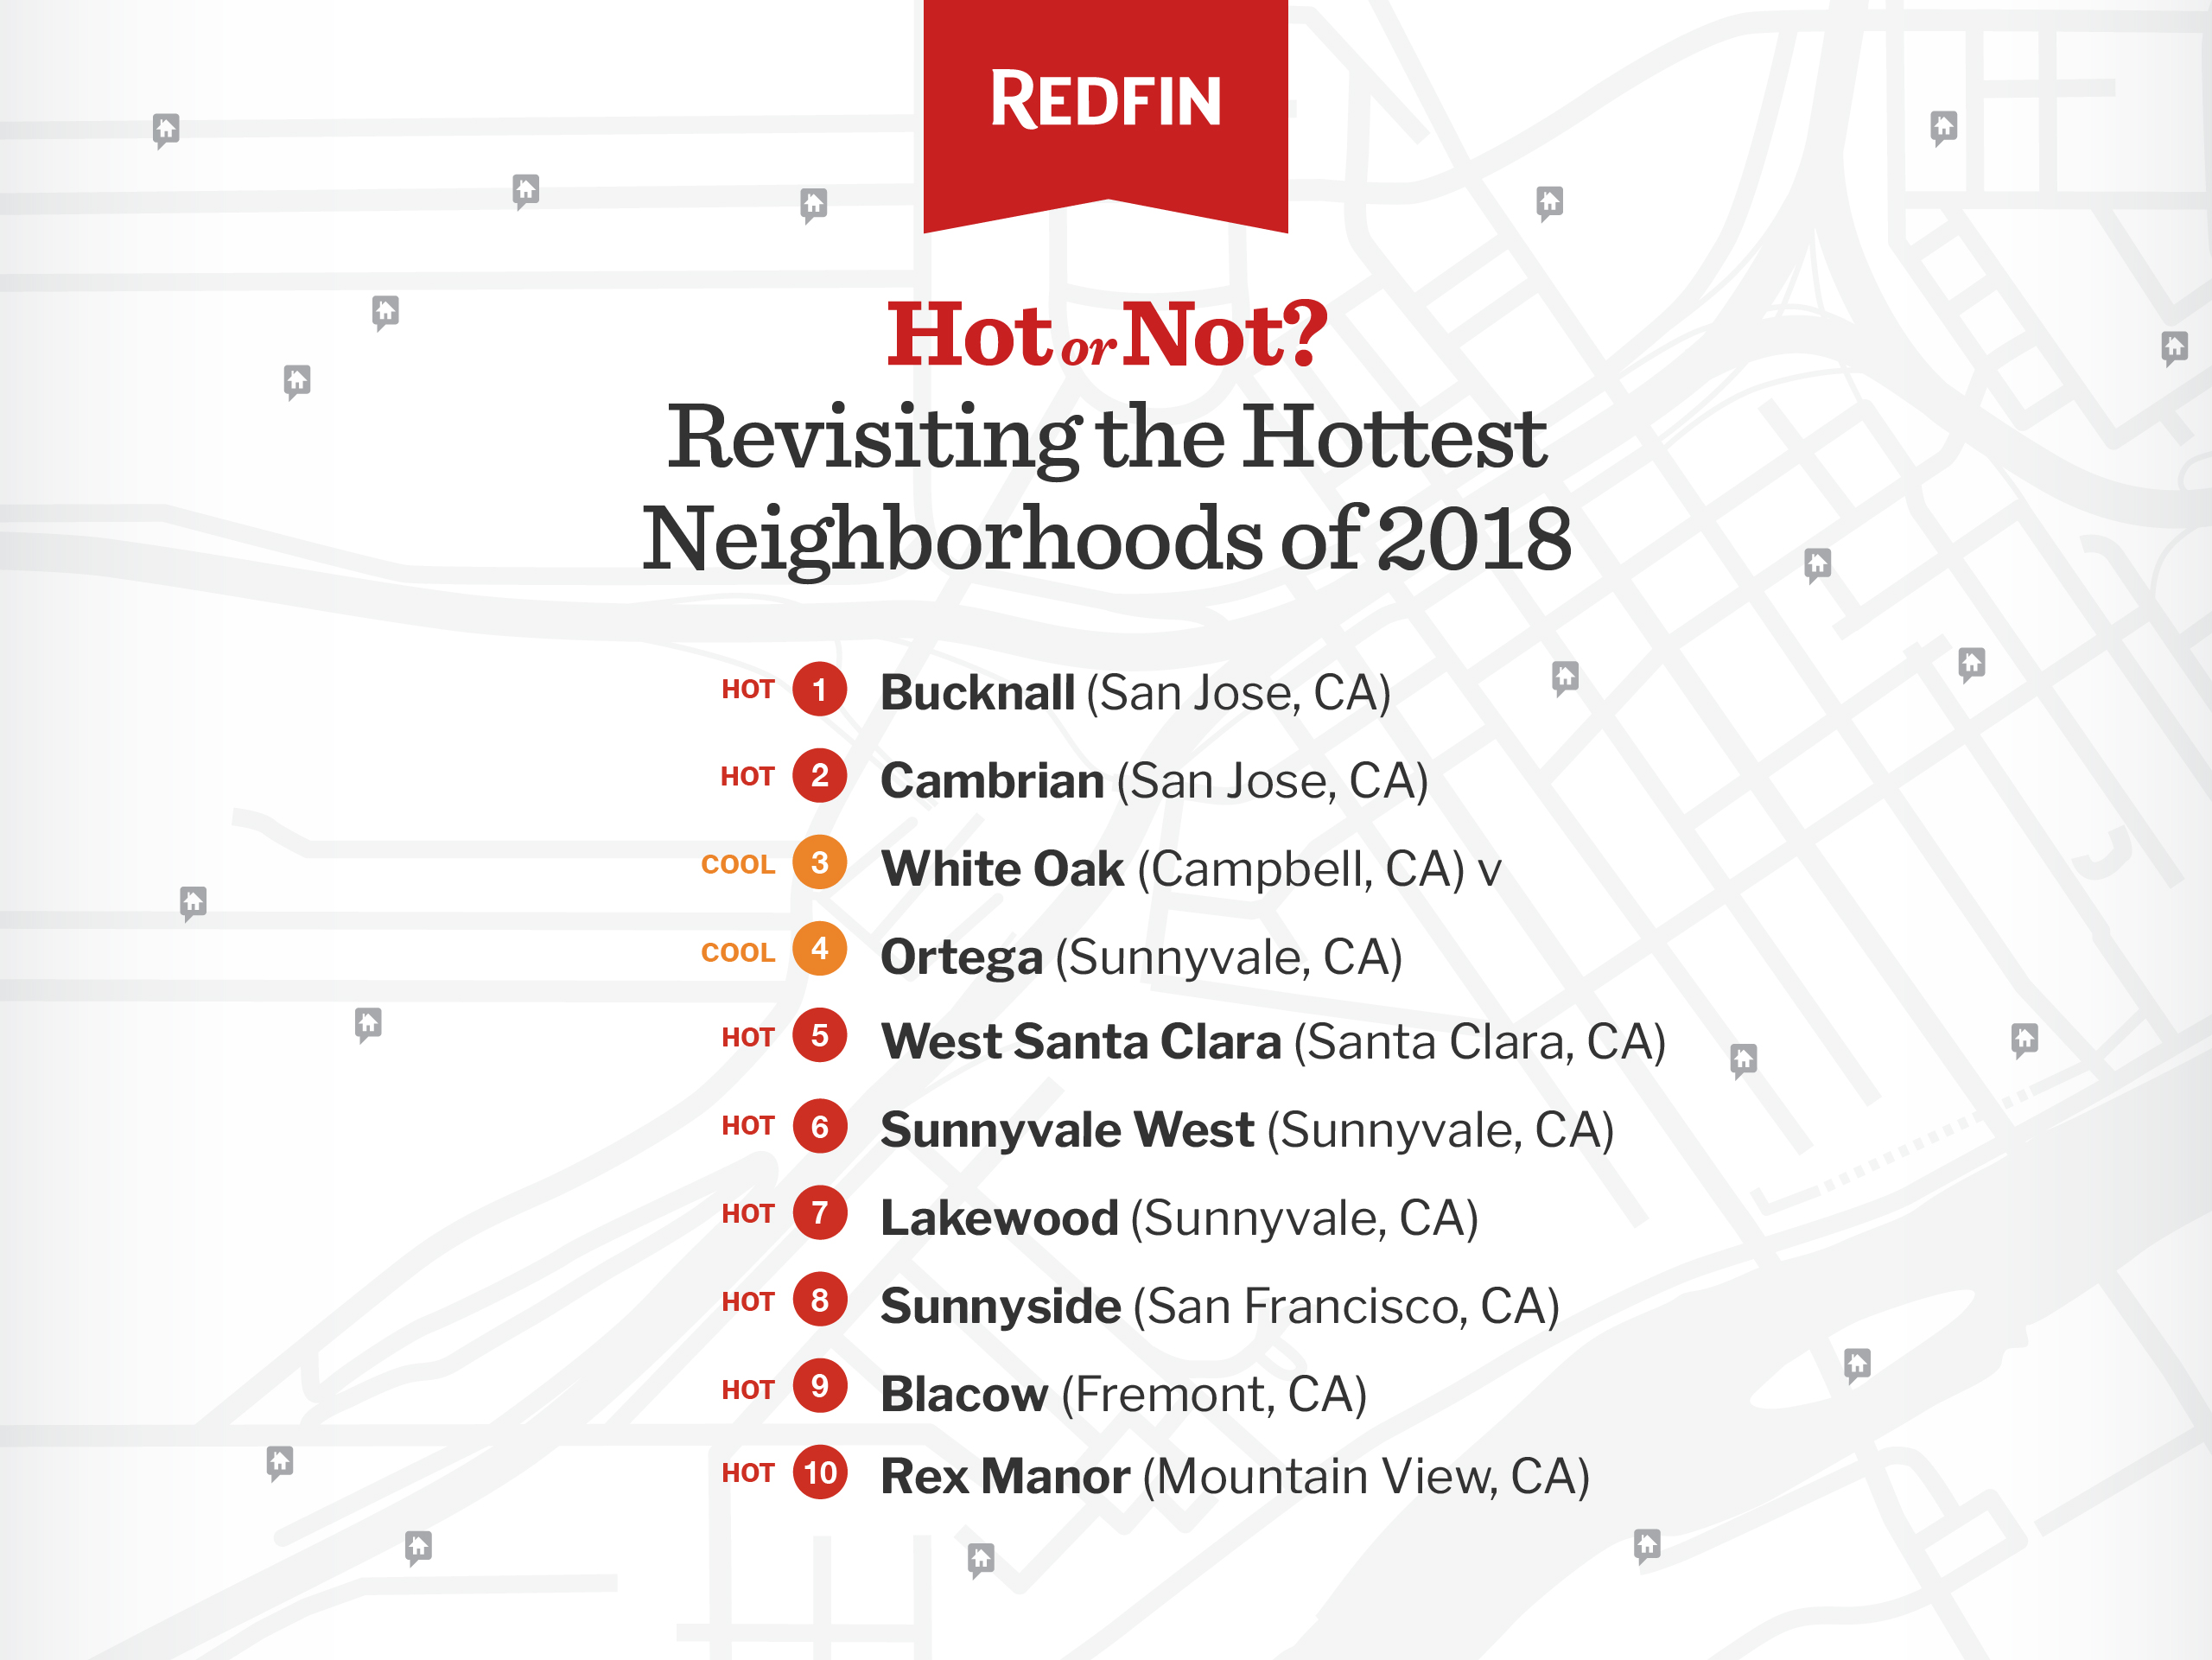
In January, we published our annual Hottest Neighborhoods report, identifying the 10 neighborhoods in the country that we predicted would see fast growth in home values this year, based on Redfin.com user data and insights from local Redfin agents. Nine of the 10 neighborhoods in the January report are in San Jose.
Now we’re checking back to see if these California neighborhoods outperformed in home value growth as predicted. We’re also identifying the hottest three neighborhoods in the largest metro areas to close out the year.
To assess the accuracy of our predictions, we calculated median home sale price growth in each neighborhood between December 2017 and July 2018. If home prices grew, the neighborhood was confirmed “hot.” If home prices declined, the neighborhood was deemed “cool.”
| Rank | Neighborhood | City | Metro Area | Median Sale Price (July 2018) | Median Sale Price (December 2017) | Percent Change | Temperature | Avg Sale-to-List Price Ratio* | % of Homes Sold Above List Price* |
| 1 | Bucknall | San Jose | San Jose | $1,661,500 | $1,565,000 | 6.2% | Hot | 100.1% | 89.0% |
| 2 | Cambrian | San Jose | San Jose | $1,320,000 | $1,244,000 | 6.1% | Hot | 108.3% | 73.7% |
| 3 | White Oak | Campbell | San Jose | $967,500 | $1,010,000 | -4.2% | Cool | 109.0% | 75.0% |
| 4 | Ortega | Sunnyvale | San Jose | $1,237,000 | $1,920,000 | -35.6% | Cool | 110.8% | 86.2% |
| 5 | West Santa Clara | Santa Clara | San Jose | $1,400,000 | $1,237,500 | 13.1% | Hot | 112.4% | 82.4% |
| 6 | Sunnyvale West | Sunnyvale | San Jose | $2,106,500 | $1,945,000 | 8.3% | Hot | 114.3% | 89.2% |
| 7 | Lakewood | Sunnyvale | San Jose | $1,355,000 | $1,200,000 | 12.9% | Hot | 100.1% | 87.0% |
| 8 | Sunnyside | San Francisco | San Francisco | $1,387,750 | $1,272,500 | 9.1% | Hot | 100.3% | 91.0% |
| 9 | Blacow | Fremont | San Jose | $1,060,999 | $1,005,000 | 5.6% | Hot | 107.6% | 81.0% |
| 10 | Rex Manor | Mountain View | San Jose | $1,670,000 | $1,500,000 | 11.3% | Hot | 100.2% | 100.0% |
| Median sale price growth between December 2017 and July 2018. | |||||||||
Eight of our 10 picks for the Hottest Neighborhoods in 2018 were spot on with price growth above 5 percent between December 2017 and July 2018. Our top pick, Bucknall (San Jose), saw prices grow 6.2 percent during that period, and 89 percent of homes sold above their asking price. Our second pick, Cambrian (San Jose), saw 6.1 percent price growth.
Redfin Silicon Valley agent Kalena Masching is not surprised that these neighborhoods saw strong price growth. Masching believes that both Cambrian and Bucknall will continue to be hot neighborhoods.
“Especially as buyers are priced out of the peninsula areas, many of these neighborhoods offer relative price savings,” said Masching. “Bucknall offers a great community vibe. It’s very walkable and also has a desirable commute. Homes in Cambrian are more affordable relative to Bucknall and the nearby areas with similar amenities. New tech campuses moving into downtown and West San Jose provide Cambrian homeowners an easy commute without being right in the middle of the city.”
West Santa Clara (Santa Clara), Lakewood (Sunnyvale), and Rex Manor (Mountain View) all experienced price growth above 10 percent.
Masching explains, “Lakewood has been hot for years, especially with home prices about a million dollars less than nearby Sunnyvale West. Similarly, Rex Manor is significantly more affordable than the surrounding parts of Mountain View. It’s a great place to get your foot in the door if you’re under a $2 million budget and want to be in Mountain View.”
White Oak and Ortega were the two predicted hottest neighborhoods, where prices actually declined between December and July.
“I’ve noticed in Ortega that single family homes are staying on the market a lot longer. Additionally, almost all of the sales from May and June were townhomes and condos, which has a lowering effect on the prices” said Masching.
What Neighborhoods Are Hot in your Metro Area?
Below we’ve ranked the top three hottest neighborhoods in each major metro area so you can see what places in your city are likely to be the most popular among buyers for the remainder of 2018. These places were identified using our Hottest Neighborhoods algorithm, which ranks neighborhoods based on increases in favorites and visits to home listings on Redfin.com.
| Metro Area | Rank | Neighborhood | Median Sale Price* | Average Sale-to-List Price Ratio* | % of Homes that Sold Above List Price* | Median Days on Market* |
| Atlanta, GA | ||||||
| 1 | Mozley Park | $226,950 | 95.8% | 31.3% | 13.5 | |
| 2 | Decatur Heights | $362,000 | 98.8% | 28.6% | 11 | |
| 3 | Sandtown | $312,750 | 97.2% | 14.3% | 90 | |
| Austin, TX | ||||||
| 1 | North Lamar | $237,000 | 98.5% | 42.1% | 7 | |
| 2 | Southeast Austin | $230,000 | 100.1% | 35.6% | 6.5 | |
| 3 | Pecan Springs Springdale | $320,000 | 98.9% | 37.0% | 10.5 | |
| Bakersfield, CA | ||||||
| 1 | Silver Creek | $235,000 | 99.1% | 2.6% | 18 | |
| 2 | Tevis Ranch | $254,990 | 100.1% | 8.0% | 31 | |
| 3 | Stockdale West | $299,950 | 100.0% | 8.3% | 39.5 | |
| Baltimore, MD | ||||||
| 1 | River Hill | $701,250 | 99.1% | 16.7% | 35 | |
| 2 | Harpers Choice | $311,250 | 99.8% | 30.4% | 36 | |
| 3 | Brooklyn Park | $185,950 | 98.5% | 29.4% | 40 | |
| Boston, MA | ||||||
| 1 | Suffolk Square | $380,000 | 106.6% | 84.2% | 8 | |
| 2 | West Street-River Street | $440,275 | 101.7% | 61.8% | 11 | |
| 3 | Southern Mattapan | $397,000 | 100.1% | 22.2% | 17 | |
| Charlotte, NC | ||||||
| 1 | Moores Chapel | $168,250 | 94.8% | 12.5% | 39 | |
| 2 | Belmont | $313,875 | 99.0% | 31.3% | 41 | |
| 3 | Villa Heights | $382,500 | 98.7% | 31.8% | 40 | |
| Chicago, IL | ||||||
| 1 | McKinley Park | $257,875 | 98.5% | 18.8% | 60.5 | |
| 2 | Chicago Lawn | $130,000 | 101.0% | 37.9% | 43 | |
| 3 | Back of the Yards | $80,000 | 103.7% | 44.8% | 23 | |
| Cincinnati, OH | ||||||
| 1 | Turpin Hills | $369,000 | 98.0% | 20.0% | 72 | |
| 2 | Mount Airy | $125,000 | 97.1% | 21.6% | 52 | |
| 3 | Mount Lookout | $375,000 | 97.8% | 17.9% | 59 | |
| Cleveland, OH | ||||||
| 1 | Boulevard | $307,500 | 95.8% | 0.0% | 70 | |
| 2 | Moreland | $73,000 | 92.5% | 0.0% | 121 | |
| 3 | Fernway | $236,000 | 95.4% | 5.0% | 82 | |
| Denver, CO | ||||||
| 1 | Genesse Central | $934,500 | 98.9% | 10.0% | 24 | |
| 2 | Turnberry | $395,000 | 99.8% | 23.1% | 23 | |
| 3 | Edgewater | $505,000 | 102.6% | 66.7% | 5.5 | |
| Fort Lauderdale, FL | ||||||
| 1 | Oakwood | $391,850 | 96.3% | 16.7% | 53 | |
| 2 | Crossings | $380,000 | 97.9% | 16.7% | 48 | |
| 3 | Lagomar | $342,550 | 97.4% | 4.2% | 44 | |
| Hampton Roads, VA | ||||||
| 1 | Old Towne | $172,250 | 94.9% | 0.0% | 84 | |
| 2 | Park Place | $169,900 | 96.2% | 29.3% | 65 | |
| 3 | Colonial Place-Riverview | $275,000 | 98.6% | 17.1% | 29 | |
| Houston, TX | ||||||
| 1 | Fourth Ward | $311,000 | 97.9% | 6.9% | 57 | |
| 2 | Kashmere Gardens | $76,500 | 88.4% | 0.0% | 49 | |
| 3 | Langham Creek | $149,500 | 98.8% | 25.0% | 10.5 | |
| Jacksonville, FL | ||||||
| 1 | Biscayne | $169,500 | 99.3% | 33.3% | 42 | |
| 2 | Jamestown | $234,900 | 97.7% | 6.7% | 21 | |
| 3 | Duclay | $183,000 | 98.6% | 25.0% | 29.5 | |
| Las Vegas, NV | ||||||
| 1 | Cadence | $397,349 | 98.9% | 9.5% | 46 | |
| 2 | Valley West | $291,000 | 98.8% | 33.3% | 47 | |
| 3 | The Crossing | $316,500 | 98.4% | 32.7% | 44 | |
| Long Island, NY | ||||||
| 1 | East Hills | $1,150,000 | 95.2% | 8.3% | 44.5 | |
| 2 | Gordon Heights | $256,500 | 102.0% | 54.6% | 29 | |
| 3 | Glen Head | $660,000 | 98.2% | 23.5% | 35 | |
| Los Angeles, CA | ||||||
| 1 | East Pasadena | $1,108,500 | 98.4% | 23.5% | 57 | |
| 2 | Citrus Grove | $662,500 | 99.4% | 50.0% | 54.5 | |
| 3 | Amar-Lark Ellen | $400,000 | 101.7% | 60.0% | 37 | |
| Memphis, TN | ||||||
| 1 | Lakes of Forest Hill | $279,900 | 97.2% | 10.3% | 43.5 | |
| 2 | Voillintine-Evergreen | $168,500 | 96.6% | 15.6% | 36.5 | |
| 3 | Normandy Meadows East | $240,000 | 99.7% | 34.8% | 28 | |
| Miami, FL | ||||||
| 1 | Crestview | $272,500 | 96.3% | 18.2% | 24 | |
| 2 | Buena Vista | $309,000 | 95.1% | 19.4% | 39 | |
| 3 | Silver Bluff | $450,000 | 95.5% | 5.7% | 83.5 | |
| Minneapolis-St. Paul, MN | ||||||
| 1 | West Frogtown | $173,050 | 104.7%
|
66.7% | 21 | |
| 2 | Bryn Mawr | $396,000 | 98.2% | 38.9% | 21 | |
| 3 | Fern Hill | $415,000 | 102.2% | 47.4% | 29.5 | |
| New Orleans, LA | ||||||
| 1 | Irish Channel | $472,500 | 98.6% | 11.1% | 79 | |
| 2 | Dillard | $220,000 | 91.9% | 0.0% | 79 | |
| 3 | Gentilly Terrace | $179,770 | 96.3% | 17.1% | 64 | |
| Oakland, CA | ||||||
| 1 | Grimmer | $1,070,000 | 115.2% | 100.0% | 10 | |
| 2 | Merriewood | $1,255,000 | 122.7% | 82.1% | 14 | |
| 3 | North Fremont | $1,210,000 | 113.8% | 93.6% | 9 | |
| Orange County, CA | ||||||
| 1 | College Park East | $876,250 | 99.7% | 50.0% | 38 | |
| 2 | Travis Ranch | $910,000 | 99.4% | 28.6% | 52 | |
| 3 | Covenant Hills Village | $1,670,000 | 97.2% | 0.0% | 89 | |
| Orlando, FL | ||||||
| 1 | Randall-Johnson | $350,800 | 98.9% | 14.8% | 35.5 | |
| 2 | Falcon Trace | $290,000 | 97.3% | 10.5% | 46 | |
| 3 | Live Oak Reserve | $466,450 | 98.8% | 16.7% | 16 | |
| Philadelphia, PA | ||||||
| 1 | Ardmore | $715,000 | 97.2% | 11.8% | 70 | |
| 2 | Somerton | $99,500 | 97.7% | 37.0% | 36 | |
| 3 | Villanova | $240,000 | 97.9% | 11.5% | 76 | |
| Phoenix, AZ | ||||||
| 1 | Emperor Estates | $322,500 | 98.9% | 28.6% | 43 | |
| 2 | O’Neil Ranch | $190,500 | 101.1% | 61.1% | 43.5 | |
| 3 | Central City South | $139,000 | 98.2% | 31.6% | 34 | |
| Pittsburgh, PA | ||||||
| 1 | East Liberty | $346,000 | 94.3% | 11.1% | 81 | |
| 2 | Reserve Township | $137,900 | 98.0% | 28.6% | 58 | |
| 3 | Squirrel Hill North | $617,500 | 94.2% | 21.4% | 80 | |
| Portland, OR | ||||||
| 1 | Overlook | $450,250 | 101.6% | 41.7% | 7 | |
| 2 | Maplewood | $550,000 | 100.1% | 25.0% | 9 | |
| 3 | Reed | $478,750 | 100.5% | 66.7% | 23 | |
| Providence, RI | ||||||
| 1 | Hebronville | $306,000 | 100.7% | 33.3% | 29 | |
| 2 | Flint | $205,000 | 97.4% | 34.5% | 16 | |
| 3 | East Side Attleboro | $280,000 | 100.0% | 48.0% | 31 | |
| Riverside-San Bernardino, CA | ||||||
| 1 | Warm Sands | $321,900 | 97.9% | 9.1% | 63 | |
| 2 | Alessandro Heights | $730,000 | 98.0% | 17.7% | 108 | |
| 3 | San Antonio Heights | $847,000 | 98.5% | 35.7% | 68 | |
| Sacramento, CA | ||||||
| 1 | Midtown | $664,250 | 100.2% | 43.8% | 58.5 | |
| 2 | Howe Edison | $260,000 | 101.6% | 77.8% | 8 | |
| 3 | Colonial Village North | $285,000 | 101.0% | 41.7% | 23 | |
| San Antonio, TX | ||||||
| 1 | Denver Heights | $122,950 | 96.0% | 0.0% | 43 | |
| 2 | Whispering Oaks | $274,000 | 100.2% | 42.9% | 24 | |
| 3 | Encino Park | $290,939 | 99.9% | 25.0% | 30.5 | |
| San Diego, CA | ||||||
| 1 | La Playa | $2,200,000 | 95.7% | 10.0% | 76 | |
| 2 | Egger Highlands | $500,000 | 99.4% | 31.3% | 26 | |
| 3 | La Costa Oaks | $1,355,025 | 99.8% | 50.0% | 14 | |
| San Francisco, CA | ||||||
| 1 | Millbrae | $1,653,000 | 115.7% | 85.7% | 14 | |
| 2 | Mission Terrace | $1,150,000 | 115.3% | 84.6% | 18 | |
| 3 | Oceanview | $1,177,500 | 121.1% | 83.3% | 19 | |
| San Jose, CA | ||||||
| 1 | Monta Loma-Farley-Rock Street | $1,639,000 | 118.8% | 96.8% | 8 | |
| 2 | Midtown | $1,025,000 | 110.1% | 85.0% | 15 | |
| 3 | San Antonio-Rengstorff-del Medio | $1,105,000 | 113.8% | 92.0% | 12 | |
| Seattle, WA | ||||||
| 1 | Ravenna | $930,000 | 108.5% | 76.2% | 7 | |
| 2 | Montlake | $1,165,000 | 103.9% | 53.3% | 8 | |
| 3 | Atlantic | $728,000 | 101.8% | 35.6% | 8.5 | |
| St. Louis, MO | ||||||
| 1 | Warson Woods | $445,000 | 98.9% | 25.0% | 37 | |
| 2 | Clifton Heights | $174,900 | 102.1% | 57.1% | 14 | |
| 3 | Rock Hill | $229,000 | 100.0% | 38.5% | 34.5 | |
| Tampa, FL | ||||||
| 1 | Old West Tampa | $216,500 | 95.4% | 8.3% | 42.5 | |
| 2 | K Bar Ranch | $369,900 | 98.3% | 8.0% | 75 | |
| 3 | Carver City-Lincoln Gardens | $175,500 | 95.8% | 6.7% | 23 | |
| Tucson, AZ | ||||||
| 1 | Sabino Springs | $363,000 | 98.2% | 0.0% | 118 | |
| 2 | Colonia del Valle | $177,000 | 97.2% | 14.3% | 57 | |
| 3 | Keeling | $139,000 | 97.6% | 9.1% | 45 | |
| Washington, DC | ||||||
| 1 | Arlington Ridge | $767,000 | 99.4% | 21.9% | 30 | |
| 2 | Brentwood / Brookland / Langdon | $589,000 | 100.1% | 43.4% | 33 | |
| 3 | Jefferson | $506,250 | 99.9% | 42.6% | 34 | |
| West Palm Beach, FL | ||||||
| 1 | Boca West | $130,000 | 84.2% | 2.7% | 126 | |
| 2 | Parrot Cove | $332,000 | 95.2% | 0.0% | 74 | |
| 3 | Kelsey City | $215,000 | 94.3% | 3.7% | 67 |
The post Hot or Not? Redfin Tests the Temperature of January’s Hottest Neighborhood Predictions appeared first on Redfin Real-Time.