Spring’s Fastest Markets are Slowing Down this Fall
Seattle, San Jose and Denver—among the nation’s fastest housing markets—are seeing a dramatic slowdown, with as little as one in three homes going under contract within 14 days, down from two in three earlier this year.
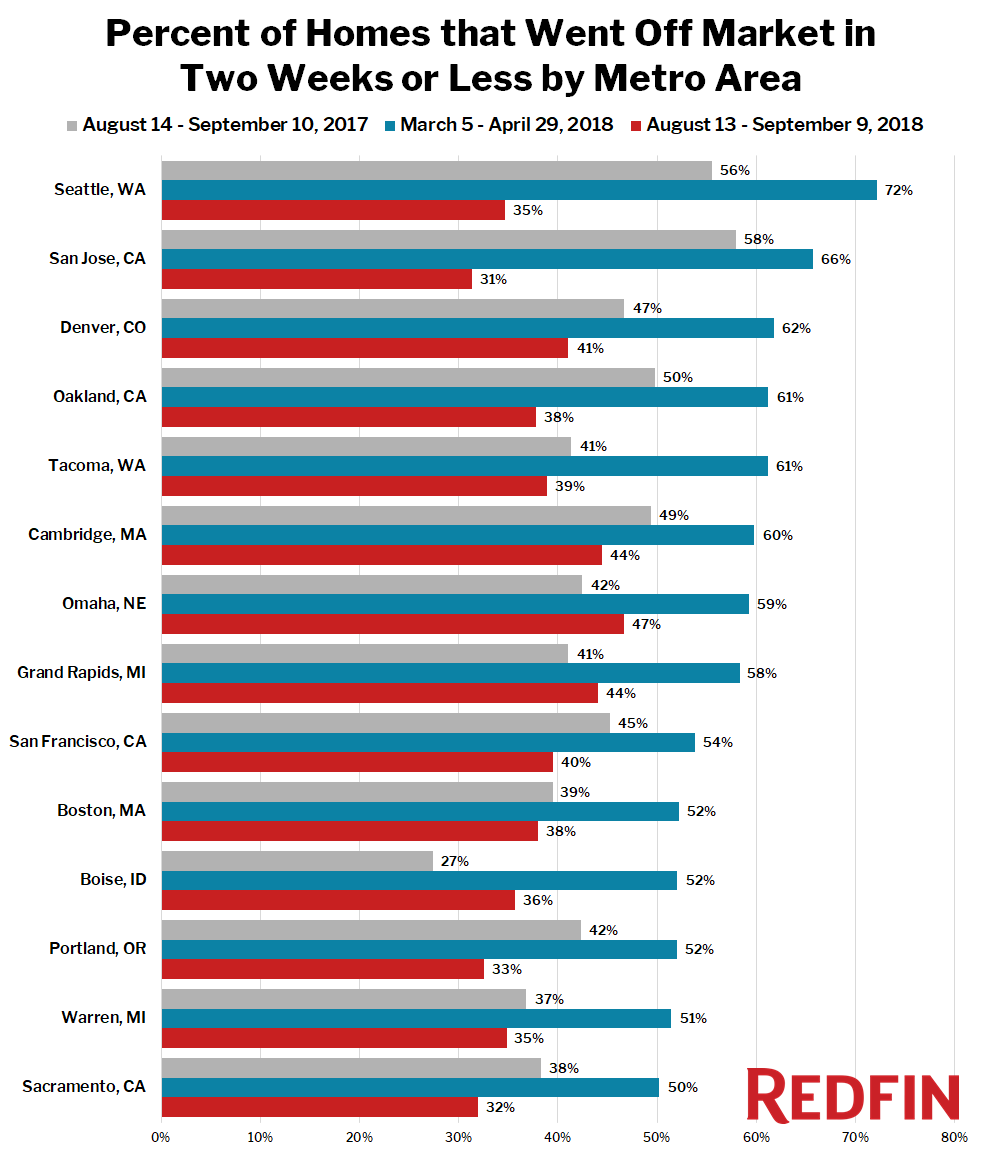
As the housing market heated up this spring there were fourteen metro areas around the country (see chart below) where half or more of the homes that were listed for sale between March 5 and April 29 went under contract within two weeks. By mid-September, every single market saw its share of homes selling that quickly fall to below 50 percent, with spring’s fastest markets, namely Seattle and San Jose, California, seeing the largest declines, falling by more than 35 percentage points since spring and over 20 percentage points from a year earlier.
“Sellers in these markets are learning that they need to adjust their strategy. They aren’t seeing the same level of interest from buyers that there was a year ago. As a result, sellers are having to wait longer for offers, and more sellers are dropping their list price to attract buyers,” said Redfin chief economist, Daryl Fairweather.
After heating up dramatically this spring, by late summer most of the hottest markets ended up cooler than a year earlier.
There are a few exceptions. Although they have slowed since spring, a few metro areas are still seeing more listings go pending quicker now than they were a year ago. The share of listings under contract in two weeks:
- rose in Omaha, NE from 42% in 2017 to 47% in 2018
- rose in Grand Rapids, MI from 41% in 2017 to 44% in 2018
- rose in Boise, ID from 27% in 2017 to 36% in 2018
The common factor among the metro areas that are not slowing down: They’re all smaller cities away from the coasts where homes are much more affordable. This points to a lack of affordability as potentially the biggest factor in why the previously red-hot markets have slowed so much this year.
Methodology
The percentages in this analysis represent the share of listings added to the market during the three periods that were changed to “sale pending” status within two weeks of their listing date. For example, a rate of 50 percent would result if 1,000 new listings were added to the market between August 14 and September 10, 2017 and 500 of those listings had changed to “sale pending” status within two weeks of their respective listing dates. Homes that were already on the market during the analysis periods were not included in any part of the calculations.
The post Spring’s Fastest Markets are Slowing Down this Fall appeared first on Redfin Real-Time.