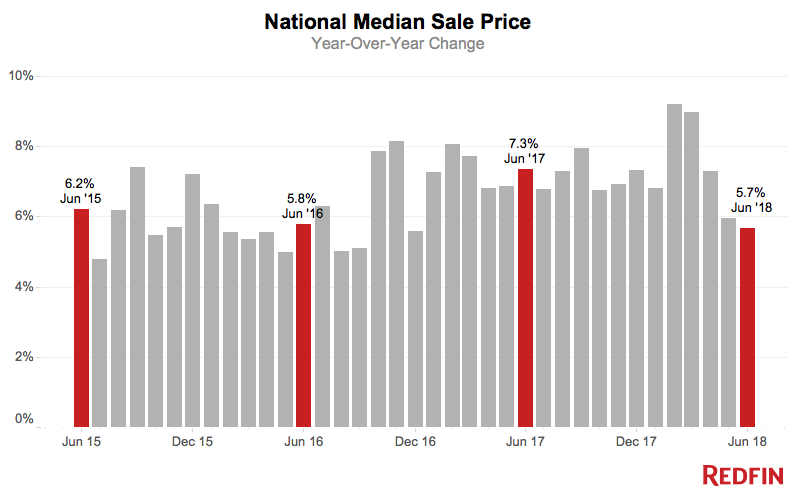
June Home Prices Rose 5.7% Year Over Year; Smallest Increase Since December 2016
Inventory Declines Continue to Moderate; Number of Homes for Sale in June Down Just 6% Compared to June 2017
U.S. home-sale prices increased 5.7 percent in June to a median of $312,700, compared to a year ago. This is the lowest price growth since December 2016. At the same time, the number of homes for sale in June was down just 6 percent year over year, which continues the gradual easing of year-over-year inventory declines since January of this year.
Homes sales fell 3.3 percent in June compared to June 2017. However, it’s important to note this is partially due to the fact that June 2017 had five Thursdays, a common day for home purchases to close, compared to this June, which had just four. If June 2017 did not have the fifth Thursday, year-over-year homes sales would be up by 1.2 percent.
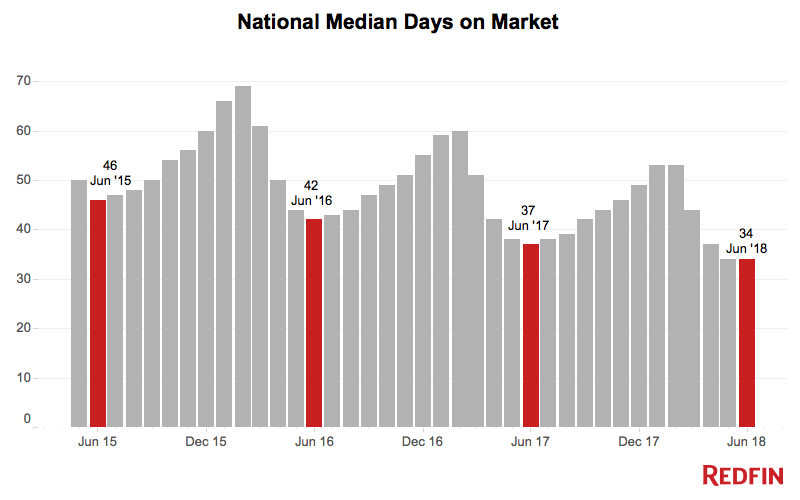
Homes also sold at their fastest pace on record, a median 34 days in June, unchanged from May and three days faster than last year.
Notably, in what have been the most competitive places for homebuyers, inventory is increasing, providing welcome relief for some buyers. The number of homes for sale in June increased by double digits in Portland (31.6%), San Jose, CA (11.9%) and Seattle (24.2%). These markets also experienced sales declines of 9.6 percent, 16.3 percent and 10.1 percent, respectively.
“The affordability crisis may have reached a breaking point in Portland, San Jose and Seattle,” said Redfin CEO Glenn Kelman. “After 75 straight months of price increases in these markets that far outpaced wage growth, homebuyers are now becoming selective about which homes to buy, and at what price. The homes that did sell in June still sold quickly, but buyers were significantly more likely to reject homes that were less desirable or aggressively priced by the seller: the percentage of listings in these markets that sold within two weeks declined in June from 61 percent to 52 percent, and the fraction of listings that dropped their price increased from 31 percent to 33 percent.”
“We’ve seen similar signs of buyer fatigue in the past, especially at this point in the season,” Kelman continued. “But in this case the lull has lasted a bit longer and affected more markets than in the recent past. It’ll be interesting to see whether buyers adjust to the latest price increase and come back in force this fall, or if instead we see these markets shift more in favor of buyers.”
“Buyers are taking advantage of the inventory windfall,” said Shoshana Godwin, a Redfin agent in Seattle. “A handful of my buyers who had been sitting out the market for over a year have, over the last two months, gotten homes under contract. We targeted homes that were still on the market after their offer review date and were able to include most offer contingencies, including the inspection. That’s been virtually unheard of in Seattle for the past few years.”
We’ll be paying close attention in the coming months to the data and to Redfin agents’ observations to see if the trends in Portland, San Jose and Seattle continue, progress or show up in other markets.
| Market Summary | June 2018 | Month-Over-Month | Year-Over-Year |
|---|---|---|---|
| Median sale price | $312,700 | 2.6% | 5.7% |
| Homes sold | 300,000 | 1.6% | -3.3% |
| New listings | 346,400 | -6.8% | -1.1% |
| All Homes for sale | 742,500 | 1.6% | -6.0% |
| Median days on market | 34 | 0 | -3 |
| Months of supply | 2.5 | 0 | 0 |
| Sold above list | 27.8% | 0.1% | 0.5% |
| Median Off-Market Redfin Estimate | $292,300 | 0.2% | 8.4% |
| Average Sale-to-list | 98.7% | 0.2% | 0.1% |
Other June Highlights
Speed
- Competitiveness eased in Seattle in terms of the portion of homes selling above asking, down 7.3 percentage points year over year from 62.1% to 54.8%. However, it was still the fastest market, with a sale pending on half of all homes in just seven days, keeping pace with June of last year. It’s important to note that the homes that sold, sold quickly. But more homes stayed on the market, hence the rise in inventory. Denver, Omaha, NE, Tacoma, WA and Grand Rapids, MI were the next fastest markets with eight median days on market each.
Prices
- San Jose, CA had the nation’s highest price growth, rising 22.4% since last year to $1,225,000. Las Vegas had the second highest growth at 12.8% year-over-year price growth, followed by Oakland, CA (11.9%), Cincinnati (11.4%), and Seattle (11.4%).
- No metros had year-over-year price declines in June.
Sales
- Three out of 73 metros saw sales surge by double digits from last year. Camden, NJ led the nation in year-over-year sales growth, up 52.4%, followed by Pittsburgh, up 10.4%. Long Island, NY rounded out the top three with sales up 10% from a year ago.
- Oxnard, CA saw the largest decline in sales since last year, falling 25.6%. Home sales in San Jose, CA and West Palm Beach, FL declined by 16.3% and 15.1%, respectively.
Inventory
- Baton Rouge, LA had the highest increase in the number of homes for sale, up 51.1% year over year, followed by Portland, OR (31.6%) and Seattle (24.2%).
- Rochester, NY had the largest decrease in overall inventory, falling 33.3% since last June. Indianapolis (-30.3%), Buffalo, NY (-30.0%), and Milwaukee (-24.2%) also saw far fewer homes available on the market than a year ago.
Redfin Estimate
- The median list price-to-Redfin Estimate ratio was 93.2% in San Francisco, the lowest of any market. This indicates the typical home for sale in June was listed at a price below its estimated value. Only 6.3% of homes in San Francisco were listed for more than their Redfin Estimate.
- Conversely, the median list price-to-Redfin Estimate ratio was 102.3% in Miami, FL and 102.1% in West Palm Beach, FL, which means sellers are listing their homes for more than the estimated value in those metro areas. In Miami, FL, 83.4% of homes were listed above their Redfin Estimate, the highest percentage of any metro.
Below are market-by-market breakdowns for prices, inventory, new listings and sales for markets with populations of 750 thousand or more. For downloadable data on all of the markets Redfin tracks, visit the Redfin Data Center.
Median Sale Price
| Redfin Metro | Median Sale Price | Month-Over-Month | Year-Over-Year |
|---|---|---|---|
| Albany, NY | $222,500 | 7.6% | 8.5% |
| Allentown, PA | $200,000 | 2.0% | 2.6% |
| Atlanta, GA | $247,000 | 1.1% | 9.8% |
| Austin, TX | $321,800 | 1.2% | 4.1% |
| Bakersfield, CA | $235,000 | 0.0% | 6.8% |
| Baltimore, MD | $282,500 | 3.3% | 2.7% |
| Baton Rouge, LA | $205,000 | 2.5% | 2.0% |
| Birmingham, AL | $214,900 | 2.3% | 7.7% |
| Boston, MA | $515,000 | 4.6% | 8.3% |
| Buffalo, NY | $155,000 | 6.9% | 5.6% |
| Camden, NJ | $187,000 | 5.1% | 5.5% |
| Charlotte, NC | $253,700 | 1.5% | 2.7% |
| Chicago, IL | $262,500 | 5.0% | 5.0% |
| Cincinnati, OH | $195,000 | 7.0% | 11.4% |
| Cleveland, OH | $155,000 | 3.4% | 3.4% |
| Columbus, OH | $220,000 | 4.8% | 11.4% |
| Dallas, TX | $304,500 | 1.5% | 3.2% |
| Denver, CO | $416,000 | 0.2% | 6.7% |
| Detroit, MI | $137,000 | 3.0% | 8.7% |
| Fort Lauderdale, FL | $280,000 | 7.3% | 7.7% |
| Fort Worth, TX | $249,900 | 2.0% | 11.1% |
| Fresno, CA | $272,000 | 0.7% | 8.3% |
| Grand Rapids, MI | $205,000 | 1.2% | 10.8% |
| Greenville, SC | $212,000 | 1.0% | 8.7% |
| Hampton Roads, VA | $240,000 | 4.3% | 0.4% |
| Honolulu, HI | $579,500 | -2.6% | 1.7% |
| Houston, TX | $244,000 | 0.6% | 1.7% |
| Indianapolis, IN | $187,500 | 1.2% | 7.2% |
| Jacksonville, FL | $239,000 | 6.2% | 8.6% |
| Kansas City, MO | $219,000 | 1.9% | 4.3% |
| Knoxville, TN | $195,000 | -0.2% | 4.0% |
| Las Vegas, NV | $273,000 | 0.4% | 12.8% |
| Long Island, NY | $445,000 | 4.7% | 7.2% |
| Los Angeles, CA | $630,000 | 0.0% | 7.2% |
| Louisville, KY | $200,000 | 6.9% | 5.3% |
| Memphis, TN | $199,900 | 3.9% | 11.1% |
| Miami, FL | $305,000 | 3.4% | 7.0% |
| Milwaukee, WI | $230,000 | 8.5% | 7.5% |
| Minneapolis, MN | $270,000 | 0.0% | 5.9% |
| Montgomery County, PA | $320,000 | 6.7% | 3.2% |
| Nashville, TN | $299,900 | 4.0% | 7.1% |
| New Orleans, LA | $225,000 | 2.3% | 4.7% |
| Oakland, CA | $800,000 | 4.6% | 11.9% |
| Oklahoma City, OK | $172,500 | 1.5% | 1.5% |
| Omaha, NE | $207,200 | 1.1% | 9.1% |
| Orange County, CA | $725,000 | 0.0% | 5.8% |
| Orlando, FL | $249,900 | 1.6% | 8.7% |
| Oxnard, CA | $627,500 | 4.6% | 8.2% |
| Philadelphia, PA | $217,000 | 7.4% | 3.3% |
| Phoenix, AZ | $270,000 | 1.5% | 9.3% |
| Pittsburgh, PA | $182,000 | 7.4% | 8.0% |
| Portland, OR | $405,000 | 1.5% | 7.2% |
| Providence, RI | $279,900 | 4.6% | 6.6% |
| Raleigh, NC | $289,000 | 1.9% | 4.8% |
| Richmond, VA | $254,000 | 3.3% | 2.9% |
| Riverside, CA | $365,000 | 1.0% | 5.8% |
| Rochester, NY | $151,200 | 1.5% | 8.0% |
| Sacramento, CA | $404,000 | 0.1% | 7.4% |
| Salt Lake City, UT | $324,400 | 1.7% | 10.0% |
| San Antonio, TX | $230,000 | 1.8% | 5.5% |
| San Diego, CA | $580,000 | 1.6% | 4.5% |
| San Francisco, CA | $1,415,000 | -1.0% | 10.1% |
| San Jose, CA | $1,225,000 | -2.0% | 22.4% |
| Seattle, WA | $585,000 | -0.2% | 11.4% |
| St. Louis, MO | $188,600 | 2.8% | 4.8% |
| Tacoma, WA | $350,500 | -5.3% | 8.9% |
| Tampa, FL | $234,000 | 3.2% | 8.8% |
| Tucson, AZ | $210,000 | 0.0% | 5.0% |
| Tulsa, OK | $168,100 | -0.6% | 2.0% |
| Warren, MI | $215,000 | 2.4% | 3.4% |
| Washington, DC | $415,000 | 3.8% | 3.8% |
| West Palm Beach, FL | $289,000 | 4.7% | 7.0% |
| Worcester, MA | $295,000 | 8.2% | 8.9% |
| National | $312,700 | 2.6% | 5.7% |
Homes Sold
| Redfin Metro | Homes Sold | Month-Over-Month | Year-Over-Year |
|---|---|---|---|
| Albany, NY | 996 | 7.8% | -2.3% |
| Allentown, PA | 949 | -3.2% | -9.4% |
| Atlanta, GA | 10,921 | -8.8% | -14.8% |
| Austin, TX | 3,474 | -1.5% | -6.5% |
| Bakersfield, CA | 859 | -5.6% | -4.9% |
| Baltimore, MD | 5,693 | 22.0% | 2.7% |
| Baton Rouge, LA | 1,018 | 3.1% | -9.2% |
| Birmingham, AL | 1,521 | -21.0% | -14.4% |
| Boston, MA | 6,086 | 37.0% | -6.3% |
| Buffalo, NY | 988 | 8.2% | -14.8% |
| Camden, NJ | 2,719 | 9.5% | 52.4% |
| Charlotte, NC | 4,333 | 4.1% | -6.6% |
| Chicago, IL | 14,535 | 16.8% | 9.8% |
| Cincinnati, OH | 2,667 | -7.5% | 1.3% |
| Cleveland, OH | 3,003 | 3.4% | -8.2% |
| Columbus, OH | 3,433 | 3.8% | 8.5% |
| Dallas, TX | 6,388 | -1.8% | -4.2% |
| Denver, CO | 5,858 | -1.3% | 0.3% |
| Detroit, MI | 1,963 | -17.8% | -2.6% |
| Fort Lauderdale, FL | 3,310 | -9.6% | -2.8% |
| Fort Worth, TX | 3,389 | -1.8% | -5.9% |
| Fresno, CA | 935 | 0.4% | -5.4% |
| Grand Rapids, MI | 1,676 | -2.0% | -3.5% |
| Greenville, SC | 1,287 | -5.6% | -2.5% |
| Hampton Roads, VA | 2,610 | 2.1% | 7.3% |
| Honolulu, HI | 904 | 10.6% | 0.9% |
| Houston, TX | 8,894 | 3.0% | 2.4% |
| Indianapolis, IN | 3,729 | 8.3% | -5.3% |
| Jacksonville, FL | 2,745 | -6.7% | -1.5% |
| Kansas City, MO | 3,868 | 3.0% | -3.9% |
| Knoxville, TN | 1,482 | -0.9% | -1.0% |
| Las Vegas, NV | 3,991 | 2.9% | -10.4% |
| Long Island, NY | 2,783 | 13.5% | 10.0% |
| Los Angeles, CA | 6,947 | 4.0% | -13.4% |
| Louisville, KY | 1,652 | 5.3% | -1.8% |
| Memphis, TN | 1,362 | -3.8% | -2.6% |
| Miami, FL | 2,609 | -16.3% | -12.4% |
| Milwaukee, WI | 2,151 | 3.6% | -5.3% |
| Minneapolis, MN | 7,276 | 9.2% | 0.2% |
| Montgomery County, PA | 3,481 | 24.9% | 7.5% |
| Nashville, TN | 3,814 | -1.9% | -4.4% |
| New Orleans, LA | 1,493 | -0.5% | -0.7% |
| Oakland, CA | 2,856 | 2.3% | -7.7% |
| Oklahoma City, OK | 2,345 | 8.4% | 7.1% |
| Omaha, NE | 1,598 | 11.5% | 9.7% |
| Orange County, CA | 2,864 | -1.9% | -11.5% |
| Orlando, FL | 4,483 | -10.4% | -0.5% |
| Oxnard, CA | 733 | -11.4% | -25.6% |
| Philadelphia, PA | 3,105 | 7.8% | 9.2% |
| Phoenix, AZ | 9,015 | -8.3% | -5.1% |
| Pittsburgh, PA | 2,910 | 15.0% | 10.4% |
| Portland, OR | 3,806 | 2.2% | -9.6% |
| Providence, RI | 2,180 | 17.9% | -5.2% |
| Raleigh, NC | 2,808 | 9.9% | -2.3% |
| Richmond, VA | 2,109 | 11.5% | -5.1% |
| Riverside, CA | 5,351 | -2.3% | -13.7% |
| Rochester, NY | 1,143 | 9.2% | -13.6% |
| Sacramento, CA | 3,065 | -2.9% | -8.6% |
| Salt Lake City, UT | 1,956 | 5.6% | -2.3% |
| San Antonio, TX | 2,975 | -1.7% | -1.6% |
| San Diego, CA | 3,453 | -0.4% | -10.5% |
| San Francisco, CA | 1,119 | -4.3% | -8.2% |
| San Jose, CA | 1,494 | -7.5% | -16.3% |
| Seattle, WA | 4,942 | 4.2% | -10.1% |
| St. Louis, MO | 4,334 | -3.8% | -6.1% |
| Tacoma, WA | 1,741 | 5.5% | -0.6% |
| Tampa, FL | 5,881 | -15.9% | -6.4% |
| Tucson, AZ | 1,681 | -4.0% | 2.6% |
| Tulsa, OK | 1,232 | -8.2% | -2.7% |
| Warren, MI | 4,160 | -13.5% | -4.7% |
| Washington, DC | 11,596 | 9.4% | 5.7% |
| West Palm Beach, FL | 3,114 | -5.9% | -15.1% |
| Worcester, MA | 1,178 | 33.6% | -5.7% |
| National | 300,000 | 1.6% | -3.3% |
New Listings
| Redfin Metro | New Listings | Month-Over-Month | Year-Over-Year |
|---|---|---|---|
| Albany, NY | 1,388 | -9.2% | 5.4% |
| Albuquerque, NM | 1,639 | -5.9% | -1.3% |
| Allentown, PA | 1,353 | -4.2% | 10.5% |
| Atlanta, GA | 12,953 | -1.2% | 7.2% |
| Austin, TX | 4,282 | -6.6% | -3.6% |
| Bakersfield, CA | 1,059 | -4.9% | -1.1% |
| Baltimore, MD | 5,074 | -12.9% | -6.1% |
| Baton Rouge, LA | 1,332 | -4.7% | 6.7% |
| Birmingham, AL | 1,782 | -4.9% | -6.2% |
| Boston, MA | 6,697 | -18.5% | 0.1% |
| Buffalo, NY | 1,415 | -12.7% | -6.0% |
| Camden, NJ | 2,423 | -10.5% | -3.0% |
| Charlotte, NC | 4,743 | -9.5% | -0.1% |
| Chicago, IL | 14,709 | -9.3% | -2.6% |
| Cincinnati, OH | 3,042 | -5.4% | -3.2% |
| Cleveland, OH | 3,717 | -1.5% | -1.7% |
| Columbus, OH | 3,638 | -9.5% | -7.6% |
| Dallas, TX | 8,850 | 0.2% | 5.7% |
| Denver, CO | 6,537 | -4.3% | -2.7% |
| Detroit, MI | 2,824 | -4.0% | -5.4% |
| Fort Lauderdale, FL | 4,037 | -4.8% | -1.5% |
| Fort Worth, TX | 4,594 | 3.4% | 8.8% |
| Fresno, CA | 1,025 | -10.2% | -7.8% |
| Grand Rapids, MI | 1,956 | -7.2% | -1.8% |
| Greenville, SC | 1,385 | -10.1% | -3.3% |
| Hampton Roads, VA | 2,974 | -5.2% | -1.8% |
| Honolulu, HI | 1,077 | -2.1% | -0.3% |
| Houston, TX | 11,461 | -6.4% | -0.6% |
| Indianapolis, IN | 4,001 | -0.7% | -0.4% |
| Jacksonville, FL | 3,187 | 0.2% | 9.9% |
| Kansas City, MO | 4,457 | -0.7% | 7.3% |
| Knoxville, TN | 1,684 | -1.0% | 16.9% |
| Las Vegas, NV | 4,524 | -0.2% | 3.2% |
| Long Island, NY | 4,006 | -13.7% | 3.3% |
| Los Angeles, CA | 8,734 | -2.1% | -2.8% |
| Louisville, KY | 1,806 | -4.7% | -13.6% |
| Memphis, TN | 1,554 | -2.6% | -6.4% |
| Miami, FL | 3,968 | -8.7% | -1.9% |
| Milwaukee, WI | 2,199 | -11.5% | -12.2% |
| Minneapolis, MN | 7,741 | -7.8% | -2.8% |
| Montgomery County, PA | 3,199 | -13.9% | -5.8% |
| Nashville, TN | 4,594 | -6.7% | 3.7% |
| New Orleans, LA | 1,691 | -7.5% | 1.4% |
| Oakland, CA | 3,383 | -5.3% | 8.6% |
| Oklahoma City, OK | 2,439 | -3.5% | -6.9% |
| Omaha, NE | 1,569 | -1.6% | -6.6% |
| Orange County, CA | 3,637 | -6.2% | -0.1% |
| Orlando, FL | 4,887 | -2.7% | -6.2% |
| Oxnard, CA | 1,020 | -7.1% | -2.8% |
| Philadelphia, PA | 3,054 | -10.9% | -4.1% |
| Phoenix, AZ | 9,213 | -4.3% | 0.5% |
| Pittsburgh, PA | 3,127 | -4.3% | 4.5% |
| Portland, OR | 5,047 | -6.6% | 5.1% |
| Providence, RI | 2,824 | -9.6% | 7.9% |
| Raleigh, NC | 2,658 | -16.3% | -9.3% |
| Richmond, VA | 2,136 | -13.7% | -6.8% |
| Riverside, CA | 6,664 | -4.2% | 1.0% |
| Rochester, NY | 1,530 | -3.8% | -1.0% |
| Sacramento, CA | 3,986 | -9.8% | -5.7% |
| Salt Lake City, UT | 2,154 | -11.8% | -16.2% |
| San Antonio, TX | 3,775 | -5.7% | -1.3% |
| San Diego, CA | 4,294 | -2.9% | -0.3% |
| San Francisco, CA | 1,266 | -3.3% | 5.1% |
| San Jose, CA | 1,711 | -14.2% | 9.8% |
| Seattle, WA | 6,276 | -8.7% | -3.0% |
| St. Louis, MO | 5,121 | -3.0% | -4.9% |
| Tacoma, WA | 1,942 | -14.6% | -11.0% |
| Tampa, FL | 6,402 | -4.0% | -3.5% |
| Tucson, AZ | 1,689 | -9.0% | 0.5% |
| Tulsa, OK | 1,503 | -1.4% | -6.0% |
| Warren, MI | 5,609 | -3.6% | -1.7% |
| Washington, DC | 10,570 | -14.8% | -8.5% |
| West Palm Beach, FL | 3,572 | -3.5% | -0.8% |
| Worcester, MA | 1,456 | -10.0% | 10.6% |
| National | 346,400 | -6.8% | -1.1% |
All Homes for Sale
| Redfin Metro | All Homes for Sale | Month-Over-Month | Year-Over-Year |
|---|---|---|---|
| Albany, NY | 2,874 | 6.6% | -14.8% |
| Albuquerque, NM | 3,726 | -17.5% | -30.0% |
| Allentown, PA | 2,710 | -4.8% | -9.6% |
| Atlanta, GA | 26,669 | 2.7% | -19.3% |
| Austin, TX | 8,196 | 4.1% | -4.3% |
| Bakersfield, CA | 2,201 | 4.9% | -0.9% |
| Baltimore, MD | 12,021 | 0.1% | 0.5% |
| Baton Rouge, LA | 4,804 | 17.1% | 51.1% |
| Birmingham, AL | 5,005 | -0.1% | -18.7% |
| Boston, MA | 8,620 | -0.1% | -1.4% |
| Buffalo, NY | 2,048 | 6.4% | -30.0% |
| Camden, NJ | 7,710 | 2.9% | -6.6% |
| Charlotte, NC | 11,293 | -0.4% | -17.6% |
| Chicago, IL | 40,554 | 0.9% | -5.8% |
| Cincinnati, OH | 7,786 | 2.5% | -5.8% |
| Cleveland, OH | 8,483 | 2.8% | -11.9% |
| Columbus, OH | 6,781 | 2.5% | -7.4% |
| Dallas, TX | 16,462 | 2.0% | 8.8% |
| Denver, CO | 7,213 | 11.7% | -2.0% |
| Detroit, MI | 4,420 | 4.1% | -5.0% |
| Fort Lauderdale, FL | 13,828 | 1.7% | 0.2% |
| Fort Worth, TX | 7,087 | 0.1% | -0.7% |
| Fresno, CA | 1,606 | 2.0% | -7.2% |
| Grand Rapids, MI | 2,461 | 11.1% | -6.9% |
| Greenville, SC | 4,166 | 2.2% | -1.0% |
| Hampton Roads, VA | 7,462 | -0.2% | -13.6% |
| Honolulu, HI | 3,373 | -1.3% | 7.8% |
| Houston, TX | 27,402 | 2.8% | -5.7% |
| Indianapolis, IN | 5,336 | 9.0% | -30.3% |
| Jacksonville, FL | 7,609 | 6.2% | 3.3% |
| Knoxville, TN | 4,687 | 0.2% | -2.5% |
| Las Vegas, NV | 9,834 | 0.9% | -7.7% |
| Long Island, NY | 11,222 | 3.1% | -3.7% |
| Los Angeles, CA | 16,737 | 0.9% | -5.7% |
| Louisville, KY | 3,162 | 4.3% | -9.1% |
| Memphis, TN | 3,145 | 1.3% | -14.0% |
| Miami, FL | 17,021 | -2.4% | -3.6% |
| Milwaukee, WI | 5,124 | 0.2% | -24.2% |
| Minneapolis, MN | 11,143 | 7.1% | -14.1% |
| Montgomery County, PA | 7,656 | 5.8% | -8.1% |
| Nashville, TN | 10,830 | 3.4% | 11.1% |
| New Orleans, LA | 6,149 | -3.4% | 5.3% |
| Oakland, CA | 3,064 | 6.8% | 0.8% |
| Oklahoma City, OK | 5,421 | 1.5% | -17.6% |
| Omaha, NE | 1,961 | 9.6% | -12.0% |
| Orange County, CA | 7,850 | 0.9% | -5.6% |
| Orlando, FL | 9,201 | -0.8% | -17.3% |
| Oxnard, CA | 1,864 | 6.6% | 9.2% |
| Philadelphia, PA | 7,071 | 4.1% | -12.9% |
| Phoenix, AZ | 18,062 | -6.1% | -13.3% |
| Pittsburgh, PA | 9,658 | -0.8% | -8.7% |
| Portland, OR | 7,441 | 13.2% | 31.6% |
| Providence, RI | 5,886 | 7.1% | -3.1% |
| Raleigh, NC | 6,482 | -6.7% | -9.0% |
| Richmond, VA | 3,414 | -1.2% | -16.1% |
| Riverside, CA | 15,468 | -0.9% | -3.4% |
| Rochester, NY | 2,071 | 8.1% | -33.3% |
| Sacramento, CA | 5,702 | 8.1% | 4.4% |
| Salt Lake City, UT | 3,089 | -21.0% | -14.9% |
| San Antonio, TX | 8,082 | -2.6% | -8.9% |
| San Diego, CA | 6,851 | 7.0% | 9.8% |
| San Francisco, CA | 1,359 | 5.7% | 0.4% |
| San Jose, CA | 1,737 | 8.6% | 11.9% |
| Seattle, WA | 6,194 | 20.9% | 24.2% |
| St. Louis, MO | 13,636 | 12.8% | 2.1% |
| Tacoma, WA | 2,250 | 9.0% | -13.9% |
| Tampa, FL | 12,500 | -1.0% | -7.9% |
| Tucson, AZ | 4,310 | -5.1% | -9.5% |
| Tulsa, OK | 3,830 | -3.2% | -12.7% |
| Warren, MI | 7,951 | 9.3% | -6.0% |
| Washington, DC | 22,755 | -1.2% | 11.9% |
| West Palm Beach, FL | 13,699 | -3.6% | -2.1% |
| Worcester, MA | 2,142 | 6.6% | -6.0% |
| National | 742,500 | 1.6% | -6.0% |
Median Off-Market Redfin Estimate
| Redfin Metro | Estimate | Month-Over-Month | Year-Over-Year |
|---|---|---|---|
| Albany, NY | $210,300 | 0.9% | 4.6% |
| Allentown, PA | $201,700 | 1.0% | 5.0% |
| Atlanta, GA | $205,900 | 1.4% | 10.5% |
| Austin, TX | $296,200 | 0.9% | 2.9% |
| Bakersfield, CA | $208,100 | 1.1% | 6.1% |
| Baltimore, MD | $249,200 | 0.7% | 2.9% |
| Baton Rouge, LA | $150,200 | 0.0% | 0.4% |
| Birmingham, AL | $145,000 | 0.8% | 6.2% |
| Boston, MA | $480,700 | 1.0% | 4.9% |
| Buffalo, NY | $150,700 | 1.4% | 6.7% |
| Camden, NJ | $189,700 | 0.7% | 3.7% |
| Charlotte, NC | $196,000 | 1.2% | 15.4% |
| Chicago, IL | $234,300 | 0.8% | 2.9% |
| Cincinnati, OH | $164,200 | 1.7% | 8.7% |
| Cleveland, OH | $134,100 | 1.3% | 4.8% |
| Columbus, OH | $183,000 | 1.1% | 10.9% |
| Dallas, TX | $250,500 | 0.8% | 8.7% |
| Denver, CO | $405,200 | 0.6% | 9.7% |
| Detroit, MI | $99,800 | 2.7% | 27.3% |
| Fort Lauderdale, FL | $254,000 | 0.6% | 8.2% |
| Fort Worth, TX | $206,100 | 1.1% | 10.5% |
| Fresno, CA | $246,100 | 0.9% | 8.9% |
| Grand Rapids, MI | $155,200 | 1.3% | 8.1% |
| Greenville, SC | $162,000 | 0.9% | 8.6% |
| Hampton Roads, VA | $220,300 | 0.7% | 3.8% |
| Honolulu, HI | $685,600 | 0.1% | 4.0% |
| Houston, TX | $201,500 | 0.7% | 6.1% |
| Indianapolis, IN | $153,600 | 1.2% | 8.4% |
| Jacksonville, FL | $208,100 | 1.0% | 14.7% |
| Kansas City, MO | $180,700 | 1.4% | 8.3% |
| Knoxville, TN | $144,400 | 1.1% | 6.2% |
| Las Vegas, NV | $260,200 | 1.6% | 16.8% |
| Long Island, NY | $427,500 | 0.3% | 6.3% |
| Los Angeles, CA | $611,300 | 0.8% | 8.2% |
| Louisville, KY | $146,500 | 0.9% | -3.6% |
| Memphis, TN | $131,700 | 1.0% | 8.6% |
| Miami, FL | $287,200 | 0.6% | 6.9% |
| Milwaukee, WI | $203,600 | 1.9% | 9.4% |
| Minneapolis, MN | $251,800 | 1.4% | 6.1% |
| Montgomery County, PA | $311,900 | 0.6% | 3.6% |
| Nashville, TN | $239,400 | 0.9% | 11.8% |
| New Orleans, LA | $164,600 | 0.6% | -5.1% |
| Oakland, CA | $765,700 | 1.4% | 10.5% |
| Oklahoma City, OK | $138,100 | 0.7% | 1.2% |
| Omaha, NE | $165,200 | 1.0% | 6.7% |
| Orange County, CA | $706,300 | 0.8% | 7.0% |
| Orlando, FL | $223,100 | 0.7% | 9.1% |
| Oxnard, CA | $593,400 | 0.7% | 5.5% |
| Philadelphia, PA | $199,500 | 1.7% | 10.4% |
| Phoenix, AZ | $259,000 | 1.0% | 7.4% |
| Pittsburgh, PA | $136,000 | 0.7% | 1.0% |
| Portland, OR | $387,700 | 0.9% | 4.4% |
| Providence, RI | $287,400 | 0.9% | 6.7% |
| Raleigh, NC | $255,600 | 0.8% | 6.6% |
| Richmond, VA | $217,800 | 1.0% | 7.2% |
| Riverside, CA | $356,100 | 0.7% | 8.8% |
| Rochester, NY | $139,600 | 1.1% | 5.1% |
| Sacramento, CA | $395,400 | 0.9% | 6.9% |
| Salt Lake City, UT | $314,000 | 1.5% | 9.7% |
| San Antonio, TX | $186,000 | 0.7% | 7.5% |
| San Diego, CA | $584,400 | 0.7% | 7.4% |
| San Francisco, CA | $1,345,000 | 0.7% | 13.4% |
| San Jose, CA | $1,282,000 | 1.4% | 26.7% |
| Seattle, WA | $563,200 | 1.3% | 14.6% |
| St. Louis, MO | $152,200 | 1.2% | 2.0% |
| Tacoma, WA | $339,900 | 2.4% | 14.3% |
| Tampa, FL | $210,800 | 0.5% | 9.6% |
| Tucson, AZ | $199,700 | 0.7% | 7.4% |
| Tulsa, OK | $135,000 | 0.1% | 0.9% |
| Warren, MI | $206,200 | 2.0% | 7.7% |
| Washington, DC | $380,700 | 0.5% | 3.0% |
| West Palm Beach, FL | $260,100 | 0.4% | 4.6% |
| Worcester, MA | $276,800 | 0.8% | 6.1% |
| National | $292,300 | 0.2% | 8.4% |
The post June Home Prices Rose 5.7% Year Over Year; Smallest Increase Since December 2016 appeared first on Redfin Real-Time.